# QA Sphere Docs
- [Introduction](/docs): Welcome to QA Sphere Documentation
- Test Management System
- [Overview](/docs/tms): Test Management System Description
- [Quick Start](/docs/quick-start): Dive in into managing your tests
- [Test Run Configuration](/docs/test-run-configuration): Set up test runs
- [Test Plans](/docs/tms/test-plans): Group related test runs into a single plan to execute and track them together
- [AI Features](/docs/tms/ai-features): Generate, review, and interrogate your test case library with QA Sphere's built-in AI
- Integrations: Connect QA Sphere with issue trackers and other tools
- [Overview](/docs/integrations-intro): Integrations Overview
- [GitHub Integration](/docs/github): Creating GitHub Issues from QA Sphere
- [Jira Integration](/docs/jira): Creating Jira Issues from QA Sphere
- [Linear Integration](/docs/linear): Creating Linear Issues from QA Sphere
- Custom Issue Trackers
- [Overview](/docs/custom-issue-trackers): Configure and use custom issue trackers with QA Sphere
- [Jira (Custom Integration)](/docs/jira-custom): Creating Jira Issues from QA Sphere using Custom Issue Tracker
- [Trello](/docs/trello): Creating Trello Cards from QA Sphere using Custom Issue Tracker
- [GitLab](/docs/gitlab): Creating GitLab Issues from QA Sphere using Custom Issue Tracker
- [Notion](/docs/notion): Creating Notion Issues from QA Sphere using Custom Issue Tracker
- [YouTrack](/docs/youtrack): Creating YouTrack Issues from QA Sphere using Custom Issue Tracker
- [ClickUp](/docs/clickup): Creating ClickUp Tasks from QA Sphere using Custom Issue Tracker
- [Zendesk](/docs/zendesk): Creating Zendesk Tickets from QA Sphere using Custom Issue Tracker
- [Sentry.io](/docs/sentry): Creating Sentry Issues from QA Sphere using Custom Issue Tracker
- [Zoho Desk](/docs/zoho-desk): Creating Zoho Desk Tickets from QA Sphere using Custom Issue Tracker
- [Document 360](/docs/document360): Creating Document 360 Tickets from QA Sphere using Custom Issue Tracker
- [Nuclino](/docs/nuclino): Creating Nuclino Items from QA Sphere using Custom Issue Tracker
- [Slack Integration](/docs/slack): Get test run and result notifications in your Slack channels
- [MCP Server](/docs/integrations/mcp): Connect Claude, Cursor, and other AI clients to your QA Sphere workspace over the Model Context Protocol
- Result Upload
- [Result Upload](/docs/integrations/result-upload): Upload JUnit XML, Playwright JSON, and Allure results to QA Sphere test runs
- [Playwright Integration](/docs/cli-usage-playwright): Use the QAS CLI to upload Playwright test results to QA Sphere
- [Cypress Integration](/docs/cli-usage-cypress): Use the QAS CLI to upload Cypress test results to QA Sphere
- [Python (pytest) Integration](/docs/cli-usage-pytest): Use the QAS CLI to upload pytest test results to QA Sphere
- [WebdriverIO Integration](/docs/cli-usage-webdriverio): Use the QAS CLI to upload WebdriverIO test results to QA Sphere
- [Uploading Playwright Results with Auto Test Case Creation](/docs/integrations/result-upload/playwright-create-tcases-guide): How to use --create-tcases to automatically create QA Sphere test cases when uploading Playwright results
- CI/CD Integrations
- [CI/CD Examples](/docs/integrations/ci-cd): Integrate QA Sphere with your CI/CD pipelines
- [GitHub Actions Integration](/docs/integrations/ci-cd/github-actions): Automate test result uploads from GitHub Actions workflows to QA Sphere using the QAS CLI tool
- [GitLab CI/CD Integration](/docs/integrations/ci-cd/gitlab): Automate test result uploads from GitLab pipelines to QA Sphere using the QAS CLI tool
- [Bitbucket Pipelines Integration](/docs/integrations/ci-cd/bitbucket): Automate test result uploads from Bitbucket Pipelines to QA Sphere using the QAS CLI tool
- Import & Export
- [Import](/docs/import): Importing test cases
- [Import from Excel or CSV](/docs/import-from-csv): Import test cases from a CSV file - a QA Sphere export, a spreadsheet saved from Excel or Google Sheets, or a file built in QA Sphere's test case format
- [Import with AI](/docs/import-with-ai): Using AI to import test cases from other tools, spreadsheets, and documents
- [Import from TestLink](/docs/import-from-testlink): Migrate test cases from TestLink to QA Sphere by exporting XML, converting it to CSV, and importing it
- [Migrate from Qase](/docs/migrate-from-qase): Export your Qase test repository to CSV and import it into QA Sphere with the built-in Qase importer
- [Migrate from TestRail](/docs/migrate-from-testrail): Export test cases from TestRail as CSV and import them into QA Sphere with the built-in TestRail importer
- [Export](/docs/export): Exporting test cases
- API: v0 api docs
- [Overview](/docs/api/api_intro): Overview of the QA Sphere Public API
- [Authentication](/docs/api/authentication): How to authenticate with the QA Sphere API
- [HTML Support](/docs/api/html-support): Understanding HTML sanitization and supported markup in QA Sphere API
- [Pagination](/docs/api/pagination): Pagination and sorting for public list endpoints
- Endpoints: API endpoint documentation
- [Audit Logs](/docs/api/audit_logs): How to retrieve audit logs using the public API
- [Folders](/docs/api/folders): How to list folders in a project using the public API
- [Milestones](/docs/api/milestone): How to list milestones in a project using the public API
- [Test Plans](/docs/api/plan): How to manage test plans using the public API
- [Projects](/docs/api/projects): Get project information in your account
- [Requirements](/docs/api/requirements): How to work with requirements using the public API
- [Results](/docs/api/result): How to add result for a test case in a run using public API
- [Runs](/docs/api/run): How to manage test runs using the public API
- [Settings](/docs/api/settings): How to check and update different settings using public API
- [Shared Preconditions](/docs/api/shared_preconditions): How to work with shared preconditions using the public API
- [Shared Steps](/docs/api/shared_steps): How to work with shared steps using the public API
- [Tags](/docs/api/tag): How to work with test case tags using the public API
- [Test Cases](/docs/api/tcases): How to work with test cases using the public API
- [Custom Fields](/docs/api/tcases_custom_fields): How to work with custom fields using the public API
- [Upload Files](/docs/api/upload_file): How to upload files using public API
- [Users](/docs/api/users): How to retrieve user information using the public API
- CLI
- [Overview](/docs/cli): Command-line interface for QA Sphere — install, authenticate, upload results, and access the public API
- [Auth](/docs/cli/auth): Authenticate the QA Sphere CLI via OAuth login or an API token
- [Public API](/docs/cli/public-api): Call the full QA Sphere REST API from the command line
- [Agent Skill](/docs/cli/agent-skill): Register the QA Sphere CLI with Claude Code, Cursor, and other AI coding agents
- Reports
- [Reports Overview](/docs/reports-overview): Comprehensive guide to QA Sphere reporting capabilities
- [View Results](/docs/reports/view-results-report): Comprehensive analysis of test case execution results across test runs
- [Detailed Results](/docs/reports/detailed-results-report): Full result detail for a test run, including tester comments, attachments, and linked issues
- [Test Runs Scorecard](/docs/reports/run-scorecard-report): Compare and analyze multiple test runs to identify trends and patterns
- [Effort by Team Member](/docs/reports/effort-by-team-member-report): Analyze individual team member testing effort, productivity, and workload distribution
- [Traceability](/docs/reports/traceability-report): Map test cases to requirements to ensure complete test coverage
- [Test Case Duration](/docs/reports/test-case-duration-report): Analyze test execution times to optimize test suites and CI/CD pipelines
- [Test Case Success Rate](/docs/reports/test-case-success-rate-report): Identify unreliable tests and track test quality across multiple executions
- [Automation Coverage](/docs/reports/automation-coverage-report): Track test automation progress and identify manual testing gaps
- Administration
- [Overview](/docs/administration-intro): Administration
- [Users and Permissions](/docs/users-permissions): Users and Permissions
- [Security](/docs/administration/security): Sign-in methods, two-factor authentication, IP restrictions, and audit logging for your workspace
- [Billing](/docs/billing): Understanding QA Sphere's flexible pricing plans
- Release Notes
- [Overview](/docs/release-notes): Latest updates and improvements to QA Sphere
- [October '26: 26W40](/docs/26W40): Release Notes for QA Sphere 26W40 update
- [September '26: 26W36 Osnova](/docs/26W36-osnova): Release Notes for QA Sphere 26W36 Osnova update
- [August '26: 26W32](/docs/26W32): Release Notes for QA Sphere 26W32 update
- [July '26: 26W28](/docs/26W28): Release Notes for QA Sphere 26W28 update
- [June '26: 26W22](/docs/26W22): Release Notes for QA Sphere 26W22 update
- [May '26: 26W17](/docs/26W17): Release Notes for QA Sphere 26W17 update
- [April '26: 26W14](/docs/26W14): Release Notes for QA Sphere 26W14 update
- [March '26: 26W10](/docs/26W10): Release Notes for QA Sphere 26W10 update
- [February '26: 26W06](/docs/26W06): Release Notes for QA Sphere 26W06 update
- [January '26: 26W02](/docs/26W02): Release Notes for QA Sphere 26W02 update
- 2025
- [2025 Release Notes](/docs/release-notes/2025): QA Sphere release notes for 2025.
- [December '25: 25W48](/docs/25W48): Release Notes for QA Sphere 25W48 update
- [November '25: 25W45](/docs/25W45): Release Notes for QA Sphere 25W45 update
- [October '25: 25W40](/docs/25W40): Release Notes for QA Sphere 25W40 update
- [September '25: 25W36](/docs/25W36): Release Notes for QA Sphere 25W36 update
- [August '25: 25W32](/docs/25W32): Release Notes for QA Sphere 25W32 update
- [July '25: 25W27](/docs/25W27): Release Notes for QA Sphere 25W27 update
- [June '25: 25W24](/docs/25W24): Release Notes for QA Sphere 25W24 update
- [June '25: 25W21](/docs/25W21): Release Notes for QA Sphere 25W21 update
- [May '25: 25W17](/docs/25W17): Release Notes for QA Sphere 25W17 update
- [April '25: 25W13](/docs/25W13): Release Notes for QA Sphere 25W13 update
- [March '25: 25W10](/docs/25W10): Release Notes for QA Sphere 25W10 update
- [February '25: 25W07](/docs/25W07): Release Notes for QA Sphere 25W07 update
- [January '25: 25W03](/docs/25W03): Release Notes for QA Sphere 25W03 update
- 2024
- [2024 Release Notes](/docs/release-notes/2024): QA Sphere release notes for 2024.
- [December '24: 24W52](/docs/24W52): Release Notes for QA Sphere 24W52 update
- [December '24: 24W48](/docs/24W48): Release Notes for QA Sphere 24W48 update
- [SAML SSO](/docs/saml): Sign in to QA Sphere through your identity provider using SAML 2.0 single sign-on
- [SCIM](/docs/scim): Provision and deprovision QA Sphere users from your identity provider using SCIM 2.0
- [Webhooks](/docs/webhooks): Receive real-time notifications when events occur in QA Sphere
- [Help and Support](/docs/help-and-support): Contact us for assistance or more details
# Overview
URL: /docs/administration-intro
QA Sphere provides you with many capabilities and options to customize and configure the application for your team and to manage projects, users and permissions based on your workflow. You can manage all settings, projects and users from QA Sphere's Admin section.
This admin guide focuses on QA Sphere's more advanced customization options and how to configure advanced user permissions and authentication workflows:
- [Users & Permissions](https://qasphere.com/docs/users-permissions):
Learn about QA Sphere's flexible user permissions and roles to customize user and project access, and how to suspend or restore access without losing history.
- [Security](https://qasphere.com/docs/administration/security):
Configure sign-in methods, two-factor authentication and its enforcement, IP allow lists, and the audit log.
- [Billing Plans](https://qasphere.com/docs/billing):
Describes all available billing plans and how to upgrade, downgrade, or reactivate your QA Sphere subscription.
## Related Pages
Two administration topics have their own top-level pages because they involve configuration on your identity provider as well as in QA Sphere:
- [SAML SSO](/docs/saml) — sign in through Okta, Microsoft Entra ID, Auth0, Google Workspace, or another SAML 2.0 provider
- [SCIM Provisioning](/docs/scim) — create, update, and deactivate QA Sphere users automatically from your identity provider
Both are available on the Business plan and above.
---
# Billing
URL: /docs/billing
## Start for Free, Pay as You Grow
At QA Sphere, we believe in allowing teams to experience the full potential of our platform before making a financial commitment. Our pricing strategy is built on three key principles:
1. **Accessibility**: Start using QA Sphere without any upfront costs.
2. **Scalability**: Choose plans that grow with your team and project needs.
3. **Flexibility**: Switch between plans at any time as your requirements change.
## Plan Comparison
| | Free | Standard | Business | Enterprise |
| --- | --- | --- | --- | --- |
| **Price** | $0 | $12 / user / month | $24 / user / month | Custom |
| Number of users | Up to 3 | Unlimited | Unlimited | Unlimited |
| Unlimited viewers | — | Yes | Yes | Yes |
| Unlimited projects | — | Yes | Yes | Yes |
| Attachment space | 1 GB | 200 GB | 1 TB+ | Custom |
| AI credits | Limited | Yes | Extended | Extended |
| Shared steps & preconditions | Yes | Yes | Yes | Yes |
| Parametrization | Yes | Yes | Yes | Yes |
| API, CLI, MCP & integrations | Yes | Yes | Yes | Yes |
| Two-factor authentication | Yes | Yes | Yes | Yes |
| SSO with Google | — | Yes | Yes | Yes |
| SAML 2.0 SSO | — | — | Yes | Yes |
| SCIM provisioning | — | — | Yes | Yes |
| Advanced authentication | — | — | Yes | Yes |
| Audit log | Basic | Basic | Extended | Extended |
| Support | Basic | Standard | Priority | Dedicated |
The [pricing page](https://qasphere.com/pricing) carries the current, authoritative version of this table.
## Pricing Tiers Explained
### Free Tier: Perfect for Small Teams and Startups
Our Free tier is designed for small teams just starting their QA journey or for those who want to explore QA Sphere's capabilities before scaling up.
**Key Features:**
- Up to 3 users
- Limited AI credits
- 1 GB attachment space
- Access to the API, CLI, MCP server, and integrations
- Two-factor authentication
- Basic Support
This tier is ideal for:
- Startups in their early stages
- Small development teams handling their own QA
- Individuals or freelancers managing multiple small projects
### Standard Tier: Growing with Your Team
As your team expands and your QA processes become more sophisticated, the Standard tier offers enhanced capabilities to support your growth.
**Price: $12 per user per month**
**Key Features:**
- Unlimited viewers (great for stakeholders who need to monitor progress)
- Unlimited projects
- AI credits for test case generation, the AI assistant, and duplicate detection
- SSO with Google, with an optional approved-domain allowlist
- 200 GB attachment space
- Standard support
This tier is perfect for:
- Medium-sized teams with multiple ongoing projects
- Organizations looking to streamline their QA processes
- Teams that need more storage and viewer access
### Business Tier: For Complex QA Needs
Larger teams with intricate QA processes will find the Business tier provides the advanced features needed to manage complex testing environments.
**Price: $24 per user per month**
**Key Features:**
- All Standard tier features
- Extended AI credits
- [SAML 2.0 SSO](/docs/saml) with Okta, Microsoft Entra ID, and other identity providers
- [SCIM 2.0 provisioning](/docs/scim) for automated user provisioning and deprovisioning
- [Advanced authentication](https://qasphere.com/docs/administration/security): workspace-wide 2FA enforcement and an IP allow list
- Extended audit log, with a [SIEM-ready audit log API](/docs/api/audit_logs)
- 1 TB+ attachment space for extensive documentation
- Priority support for quick issue resolution
Ideal for:
- Large QA teams working on multiple complex projects
- Organizations with strict security and user management requirements
- Teams needing extensive storage for test artifacts and results
### Enterprise Tier: Tailored Solutions
For organizations with unique needs or specific compliance requirements, our Enterprise tier offers a customizable solution.
**Key Features:**
- All Business tier features
- Tailored features to meet organizational or compliance needs
- Custom storage and dedicated support
This tier is designed for:
- Large corporations with specific compliance needs
- Organizations requiring custom integrations or features
- Teams needing a tailored QA solution that fits into their existing workflows
Enterprise plans are arranged directly — contact [sorted@qasphere.com](mailto:sorted@qasphere.com) to discuss requirements.
## Free Trial
New workspaces start on a **30-day free trial** of the paid functionality, with no credit card required. During the trial you can change subscription settings such as user count, so you can size the plan against the team that will actually use it before you commit.
### When the Trial Ends
If you have not subscribed by the time the trial expires, what happens depends on whether your workspace fits inside the Free tier:
- **Within Free-tier limits** (3 users or fewer) — the workspace may be transferred to the Free plan and you keep working.
- **Over Free-tier limits** — access is **suspended**, and the account is **deleted 14 days after suspension**.
If your trial workspace has more than three users, it will not roll over to the Free tier on its own. Either subscribe or reduce the workspace to within Free-tier limits before the trial expires. Once suspended, you have 14 days to act before the account and its data are deleted.
The [Terms of Use](https://qasphere.com/legal/terms) are the authoritative statement of this behaviour.
## Managing Your Subscription
Billing is managed in **Settings → Billing**.
- **Change plan** — move between plans at any time. You are not locked into a tier that no longer matches your needs.
- **Adjust seats** — change the number of users on the subscription as the team grows or shrinks.
- **Billing contact and address** — enter your full billing address in the billing contact form. The phone field detects and pre-fills the country code.
- **Reactivate** — a cancelled subscription can be reactivated without recreating the workspace, keeping all existing projects, test cases, and history.
### Viewers Do Not Consume Seats
On paid plans, **Viewer** accounts are unlimited and free. Product managers, developers, and other stakeholders who only need to follow quality status can be added without affecting your bill. Only roles above Viewer count toward the per-user price.
On free accounts the paid-seat and viewer distinction does not apply; the overall user limit governs instead.
See [Users and Permissions](https://qasphere.com/docs/users-permissions) for what each role can do.
## Choosing the Right Plan
When selecting a plan, consider the following factors:
1. **Team Size**: How many active users will need access to QA Sphere? Remember that viewers are unlimited and free.
2. **Project Complexity**: Do you manage multiple projects or have complex testing requirements?
3. **Storage Needs**: How much documentation and test artifact storage do you require?
4. **AI Usage**: How heavily will you use AI generation and the AI assistant? See [AI Features](/docs/tms/ai-features) for what consumes credits.
5. **Security Requirements**: Do you need SAML SSO, SCIM provisioning, 2FA enforcement, or an IP allow list? Those are Business-tier features.
6. **Support Level**: What level of support does your team need to operate efficiently?
Remember, you can start with the Free tier to explore QA Sphere's capabilities and upgrade as your needs grow. Our flexible structure ensures that you're never locked into a plan that doesn't serve your current needs.
---
# Security
URL: /docs/administration/security
Workspace-wide security is configured in **Settings → Security**. This page covers the controls available there and how they interact. Configuring them requires the **Admin** or **Owner** role.
## Sign-In Methods
QA Sphere supports several ways in, and you choose which are enabled for your workspace:
| Method | Availability | Notes |
| --- | --- | --- |
| **Password** | All plans | Email and password, with optional two-factor authentication |
| **Google Sign-In** | All paid plans | Can be restricted to approved email domains |
| **SAML 2.0 SSO** | Business plan and above | Okta, Microsoft Entra ID, Auth0, Google Workspace, JumpCloud, and others — see [SAML SSO](/docs/saml) |
At least one sign-in method must remain enabled at all times. Disabling a method signs out every user who has no remaining allowed method, so check who depends on a method before turning it off.
To make SSO the only way in, turn off both **Password Authentication** and **Sign in with Google** once SAML is verified.
### Restricting Google Sign-In to Your Domains
Google Sign-In accepts any Google account by default. Add an allowlist of approved email domains to limit it to accounts you control, so a personal Gmail address cannot be used to reach an invited seat. The allowlist is part of the Google Sign-In configuration, so it is available wherever Google Sign-In is.
If your organization uses several verified domains, list all of them. Users whose Google account falls outside the allowlist are rejected at sign-in.
## Two-Factor Authentication
Two-factor authentication is available on **every plan**, and any user can enable it for their own account from their profile.
### Enforcing 2FA Workspace-Wide
On the **Business plan**, admins can require 2FA for everyone in the workspace. When you enable enforcement:
- Users who already have 2FA configured are unaffected.
- Users without 2FA are signed out and must complete 2FA setup on their next sign-in.
Enforcement signs out every user who has not yet set up 2FA. Announce it before you enable it, or you will field a wave of confused messages from people who cannot get back in.
The 2FA status of each member is visible and sortable in **Settings → Members**, which is the quickest way to see who still needs to enrol before you enforce.
2FA applies to password sign-ins. For SAML sign-ins, multi-factor authentication is your identity provider's responsibility — QA Sphere does not run its own challenge on top of a SAML assertion.
## IP Allow List
On the **Business plan**, workspace access can be restricted to a list of approved IP addresses or CIDR ranges — useful when access should only be possible from an office network or a corporate VPN.
Before enabling it, work through the list of everything that reaches your workspace:
- **Your own current address**, or you will lock yourself out along with everyone else
- **Remote and travelling team members**, whose addresses change
- **CI/CD runners** that upload results through the [CLI](/docs/cli) or call the [public API](/docs/api/api_intro) — cloud runners often use wide, changing ranges
- **Webhook and integration callbacks**, if they originate from your own infrastructure
Before switching the allow list on, confirm whether it also covers API and CLI traffic in your configuration. If it does, a pipeline that uploads test results will start failing as soon as its runner's egress addresses fall outside the list. Test it against a non-critical pipeline first.
## Managing User Access
### Suspending and Restoring Users
Admins can **suspend** a user instead of deleting them. A suspended user cannot sign in, but their account and everything they authored — test cases, runs, results, audit history — is preserved intact. Restoring access is a single action.
Suspend rather than delete when someone leaves a team temporarily, when an account may be compromised, or when you want to free a seat without losing attribution. See [Users and Permissions](https://qasphere.com/docs/users-permissions) for roles and project access.
API keys owned by a suspended user stop working: requests made with them return `403`. If a departing user's key is used by a pipeline, reissue the key under a different account before suspending them.
### Automated Provisioning
On the Business plan, [SCIM 2.0](/docs/scim) lets your identity provider create, update, and deactivate QA Sphere users automatically. Setting `active: false` from the IdP suspends the user in the same way as the manual action above; `active: true` restores them.
## Audit Log
Every significant action in the workspace is recorded in the audit log, viewable under **Settings → Audit Log**. It covers user and permission changes, integration and webhook configuration changes, SCIM-driven changes, and **rejected authentication attempts**, which can be filtered specifically when investigating suspicious sign-in activity.
For SIEM ingestion, the audit log is available through the public API, and you can create API keys restricted to only that endpoint by naming them with the `SIEM-LOG-ONLY` prefix — a key named `SIEM-LOG-ONLY-splunk` can read audit logs and nothing else. See the [Audit Logs API](/docs/api/audit_logs).
## What Each Plan Includes
| Control | Free | Standard | Business | Enterprise |
| --- | --- | --- | --- | --- |
| Two-factor authentication (per user) | Yes | Yes | Yes | Yes |
| Google Sign-In (and its domain allowlist) | — | Yes | Yes | Yes |
| SAML 2.0 SSO | — | — | Yes | Yes |
| SCIM provisioning | — | — | Yes | Yes |
| Audit log | Basic | Basic | Extended | Extended |
| **Advanced authentication**: 2FA enforcement, IP allow list, audit log API for SIEM | — | — | Yes | Yes |
See [Billing](https://qasphere.com/docs/billing) for full plan details.
---
# Users and Permissions
URL: /docs/users-permissions
Effective user management and role-based access control are crucial for maintaining security and efficiency in your QA processes. QA Sphere offers a flexible and robust permissions system that allows you to fine-tune access levels for each member of your team. This guide will walk you through the various roles available in QA Sphere and how to manage them.
## Understanding QA Sphere Roles
QA Sphere provides five distinct roles, each with its own set of permissions and responsibilities. These roles are designed to cater to different levels of involvement and authority within your QA process.
### 1. Owner
The Owner role is the highest level of authority in QA Sphere.
**Key Characteristics:**
- There can only be one Owner per QA Sphere instance.
- The Owner is typically the first user who set up the QA Sphere account.
- This role cannot be deleted.
**Permissions:**
- Has unrestricted access to all features and settings.
- Can change anything within the system.
- Can assign the Owner role to another user (in which case, the current Owner becomes an Admin).
**Best Practices:**
- Reserve this role for the highest level of management or the primary stakeholder of the QA process.
- Consider transitioning to an Admin role once the system is set up and stable, to reduce the risk of accidental system-wide changes.
### 2. Admin
The Admin role is designed for users who need comprehensive control over the QA Sphere instance, but with some limitations compared to the Owner.
**Permissions:**
- Can change almost anything in the system.
- Has access to all projects and global settings.
- Can manage users, including creating new users and assigning roles.
- Cannot delete the Owner or change the Owner's permissions.
**Best Practices:**
- Assign this role to QA managers or team leads who need to oversee multiple projects and manage team members.
- Limit the number of Admins to maintain better control and security.
### 3. User
The User role is suitable for team members actively involved in the QA process across one or more projects.
**Permissions:**
- Can work on specific projects or all projects (as assigned by an Admin or Owner).
- Can create and manage test runs, milestones, and test cases within their assigned projects.
- Cannot add new projects, rename/complete/delete projects, manage users, or change global settings.
**Best Practices:**
- This should be the default role for most team members involved in creating and executing tests.
- Regularly review User project assignments to ensure they have access to all necessary projects.
### 4. Test Runner
The Test Runner role is designed for team members primarily responsible for executing test runs.
**Permissions:**
- Can work on test runs of specific projects (or all projects, as assigned).
- Can update test run status and results.
- Cannot modify test cases or create new ones.
- Cannot change project settings or manage users.
**Best Practices:**
- Assign this role to team members focused on test execution, such as QA testers or automated testing systems.
- Ensure Test Runners have clear guidelines on how to report and document test results.
### 5. Viewer
The Viewer role provides read-only access to QA Sphere, suitable for stakeholders who need to monitor progress but should not make changes.
**Permissions:**
- Can view information in specific projects or all projects (as assigned).
- All access is read-only; cannot make any changes to test cases, runs, or settings.
**Best Practices:**
- Use this role for external stakeholders, clients, or team members who need to stay informed but are not directly involved in the QA process.
- Regularly review Viewer access to ensure they only have visibility to relevant projects.
Viewer seats are **unlimited and free** on paid plans. Stakeholders who only need to follow quality status should be Viewers — they do not count toward your per-user bill. See [Billing](https://qasphere.com/docs/billing#viewers-do-not-consume-seats).
## Project Access
A role decides *what* a user can do; project access decides *where* they can do it. Users, Test Runners, and Viewers are granted access either to **all projects** or to a specific set of projects, chosen when you invite them and changeable at any time from **Settings → Members**.
Owners and Admins always have access to every project, so project access does not apply to them.
The **Access** column in the Members table shows each user's current scope, and the table can be sorted by it — useful when reviewing who can reach a sensitive project.
## Managing Users and Permissions
As an Owner or Admin, you have the responsibility of managing users and their permissions. Here's how to effectively manage your team in QA Sphere:
1. **Adding New Users:**
- Navigate to the **Settings** > **Members**.
- Use **Email** field to invite new users to the team
- Assign the appropriate role and project access and click **Send Invite**.
2. **Modifying User Roles:**
- Navigate to the **Settings** > **Members**.
- Click
- Change **Role** in the appropriate field
3. **Reviewing the Member List:**
- The Members table can be sorted by Name/Email, Role, 2FA, and Access. Sorting cycles ascending → descending → reset, and the indicators stay visible.
- Sorting by **2FA** is the quickest way to see who has not yet enrolled, which matters before you [enforce two-factor authentication](https://qasphere.com/docs/administration/security#enforcing-2fa-workspace-wide).
4. **Best Practices for User Management:**
- Regularly audit user roles and permissions to ensure they align with current responsibilities.
- Implement a process for reviewing and updating permissions when team members change roles.
- Use groups to manage permissions for multiple users with similar roles more efficiently.
- Always follow the principle of least privilege: give users only the permissions they need to perform their tasks.
## Suspending and Restoring Access
When someone should lose access but their history should be kept, **suspend** them instead of deleting the account. A suspended user cannot sign in, while everything they authored — test cases, runs, results, and audit history — stays intact and correctly attributed. Restoring access is a single action.
Suspend rather than delete when a team member is on extended leave, when an account may be compromised, or when you want to free a seat without losing attribution.
API keys owned by a suspended user stop working and return `403`. If one of that user's keys is used by a CI pipeline or an integration, reissue it under a different account before suspending them.
On the Business plan, [SCIM 2.0](/docs/scim) can drive this automatically from your identity provider: unassigning a user in the IdP suspends them in QA Sphere, and reassigning them restores access.
## Authentication and Workspace Security
Roles control what a user can do once they are in. How they get in, and who is allowed to try, is configured separately:
- **[Security](https://qasphere.com/docs/administration/security)** — sign-in methods, two-factor authentication and its enforcement, IP allow lists, and the audit log
- **[SAML SSO](/docs/saml)** — sign in through your identity provider (Business plan and above)
- **[SCIM provisioning](/docs/scim)** — automate the user lifecycle from your IdP (Business plan and above)
## Conclusion
Understanding and properly utilizing QA Sphere's role-based access control is key to maintaining a secure and efficient QA environment. By carefully assigning roles and permissions, you can ensure that each team member has the access they need while maintaining the integrity and security of your QA processes.
Remember, the goal is to balance accessibility with security. Regularly review and adjust your user permissions to adapt to your team's changing needs and to maintain optimal workflow in your QA processes.
---
# Overview
URL: /docs/api/api_intro
Welcome to the QA Sphere API documentation. Our API allows you to programmatically manage test cases, runs, and results in your QA Sphere projects.
## Authentication
All API requests require authentication using an API key. See the [Authentication](https://qasphere.com/docs/api/authentication) guide to get started.
## Base URL
```
https://{your-company}.{your-region-code}.qasphere.com/api/public/v0
```
## Response Format
All responses are returned in JSON format. Successful responses typically include:
- Status codes in the 2XX range
- Data specific to the endpoint
- Pagination information where applicable
Error responses include:
- Status codes in the 4XX or 5XX range
- Error message explaining the issue
- Additional context where available
## Rate Limiting
API requests are rate limited to protect the service and ensure fair usage.
- **20 requests per second** sustained, per user, with a **burst capacity of 40**
The limit is applied **per user, not per API key**. Every API key you create belongs to the
user who created it, and all of that user's API keys and OAuth authorizations draw from the
same 20 requests per second. Creating additional API keys under the same account will not
raise your throughput — if you need more, distribute the work across separate user accounts.
The limit uses a token bucket with a capacity of 40 that refills at 20 tokens per second, and
each request consumes one token. A client that has been idle for at least two seconds can
therefore issue up to 40 requests at once; after the bucket is drained, sustained traffic is
capped at 20 requests per second. There is no saving up beyond the 40-token capacity.
### Handling a 429
When you exceed the limit, the API returns `429 Too Many Requests`:
```json
{
"message": "Too many requests, please try again later."
}
```
The response includes a `Retry-After` header giving the number of seconds to wait before the
next request will be accepted:
```
HTTP/1.1 429 Too Many Requests
Retry-After: 1
X-RateLimit-Scope: public_api
```
Wait at least that long before retrying. If the header is missing, fall back to exponential
backoff.
`X-RateLimit-Scope: public_api` marks a `429` that came from the per-user throughput limit — your
credentials were accepted and only your request rate was too high, so retrying after `Retry-After`
will succeed.
### Repeated authentication failures
A `429` **without** the `X-RateLimit-Scope` header means the requests reaching us are being
rejected before they are authenticated. Sending invalid credentials repeatedly gets your IP rate
limited even though no single request succeeds, so make sure retry logic stops on `401` instead of
retrying it — waiting out a single `Retry-After` will not clear this one while the failures
continue.
### OAuth device flow limits
The device flow is limited separately and does **not** use `429`. Both endpoints reject with
`400` and an RFC 8628 `slow_down` error, and neither sends a `Retry-After` header:
```json
{
"error": "slow_down",
"error_description": "polling too frequently"
}
```
| Limit | Scope | Applies to | Handled by |
| --------------- | --------------- | --------------------------------------------------------------- | --------------------------------- |
| 1 per 5 seconds | Per device code | Polling the token endpoint (RFC 8628 §3.4) | The OAuth client or tool |
| 10 per minute | Per IP address | Requesting a code from the device authorization endpoint (§3.1) | The person starting authorization |
Token polling is normally performed by the OAuth client or tool, not by the person authorizing
it. The client must start with the `interval` returned by the device authorization endpoint. If
the token endpoint returns `slow_down`, it must increase that interval by 5 seconds before
continuing to poll, as RFC 8628 §3.5 describes. The
[QA Sphere CLI](https://github.com/Hypersequent/qas-cli) handles this automatically.
Requesting a new device code starts a new authorization attempt and is under the user's control.
If that endpoint returns `slow_down`, wait before starting another attempt instead of repeatedly
requesting new codes.
### Staying under the limit
- Retry on `429` with exponential backoff, honoring `Retry-After`
- For ordinary public API requests, do not retry `4xx` responses other than `429`. OAuth device
flow clients must continue on `authorization_pending` and retry more slowly on `slow_down`
- Use batch endpoints instead of many individual requests where one exists
- Cache responses that change infrequently, such as project and folder listings
- Keep client-side concurrency modest; parallel workers share the same per-user budget
If you use the [QA Sphere CLI](https://github.com/Hypersequent/qas-cli), all of this is handled
for you, from v0.8.0 onward. Earlier versions do not recognize `429` and will fail against these
limits, so upgrade if you are on v0.7.0 or older.
**Getting Started**
1. [Create an API key](https://qasphere.com/docs/api/authentication#creating-an-api-key)
2. Test the authentication with the [tags endpoint](https://qasphere.com/docs/api/tag)
3. Explore the available endpoints based on your needs
**Need Help?**
- Contact [support](mailto:sorted@qasphere.com) for assistance
- Report issues through your account dashboard
---
# Authentication
URL: /docs/api/authentication
The QA Sphere API uses API keys for authentication. Each request to the API must include a valid API key that is associated with your account. You can manage your API keys through the QA Sphere web application settings.
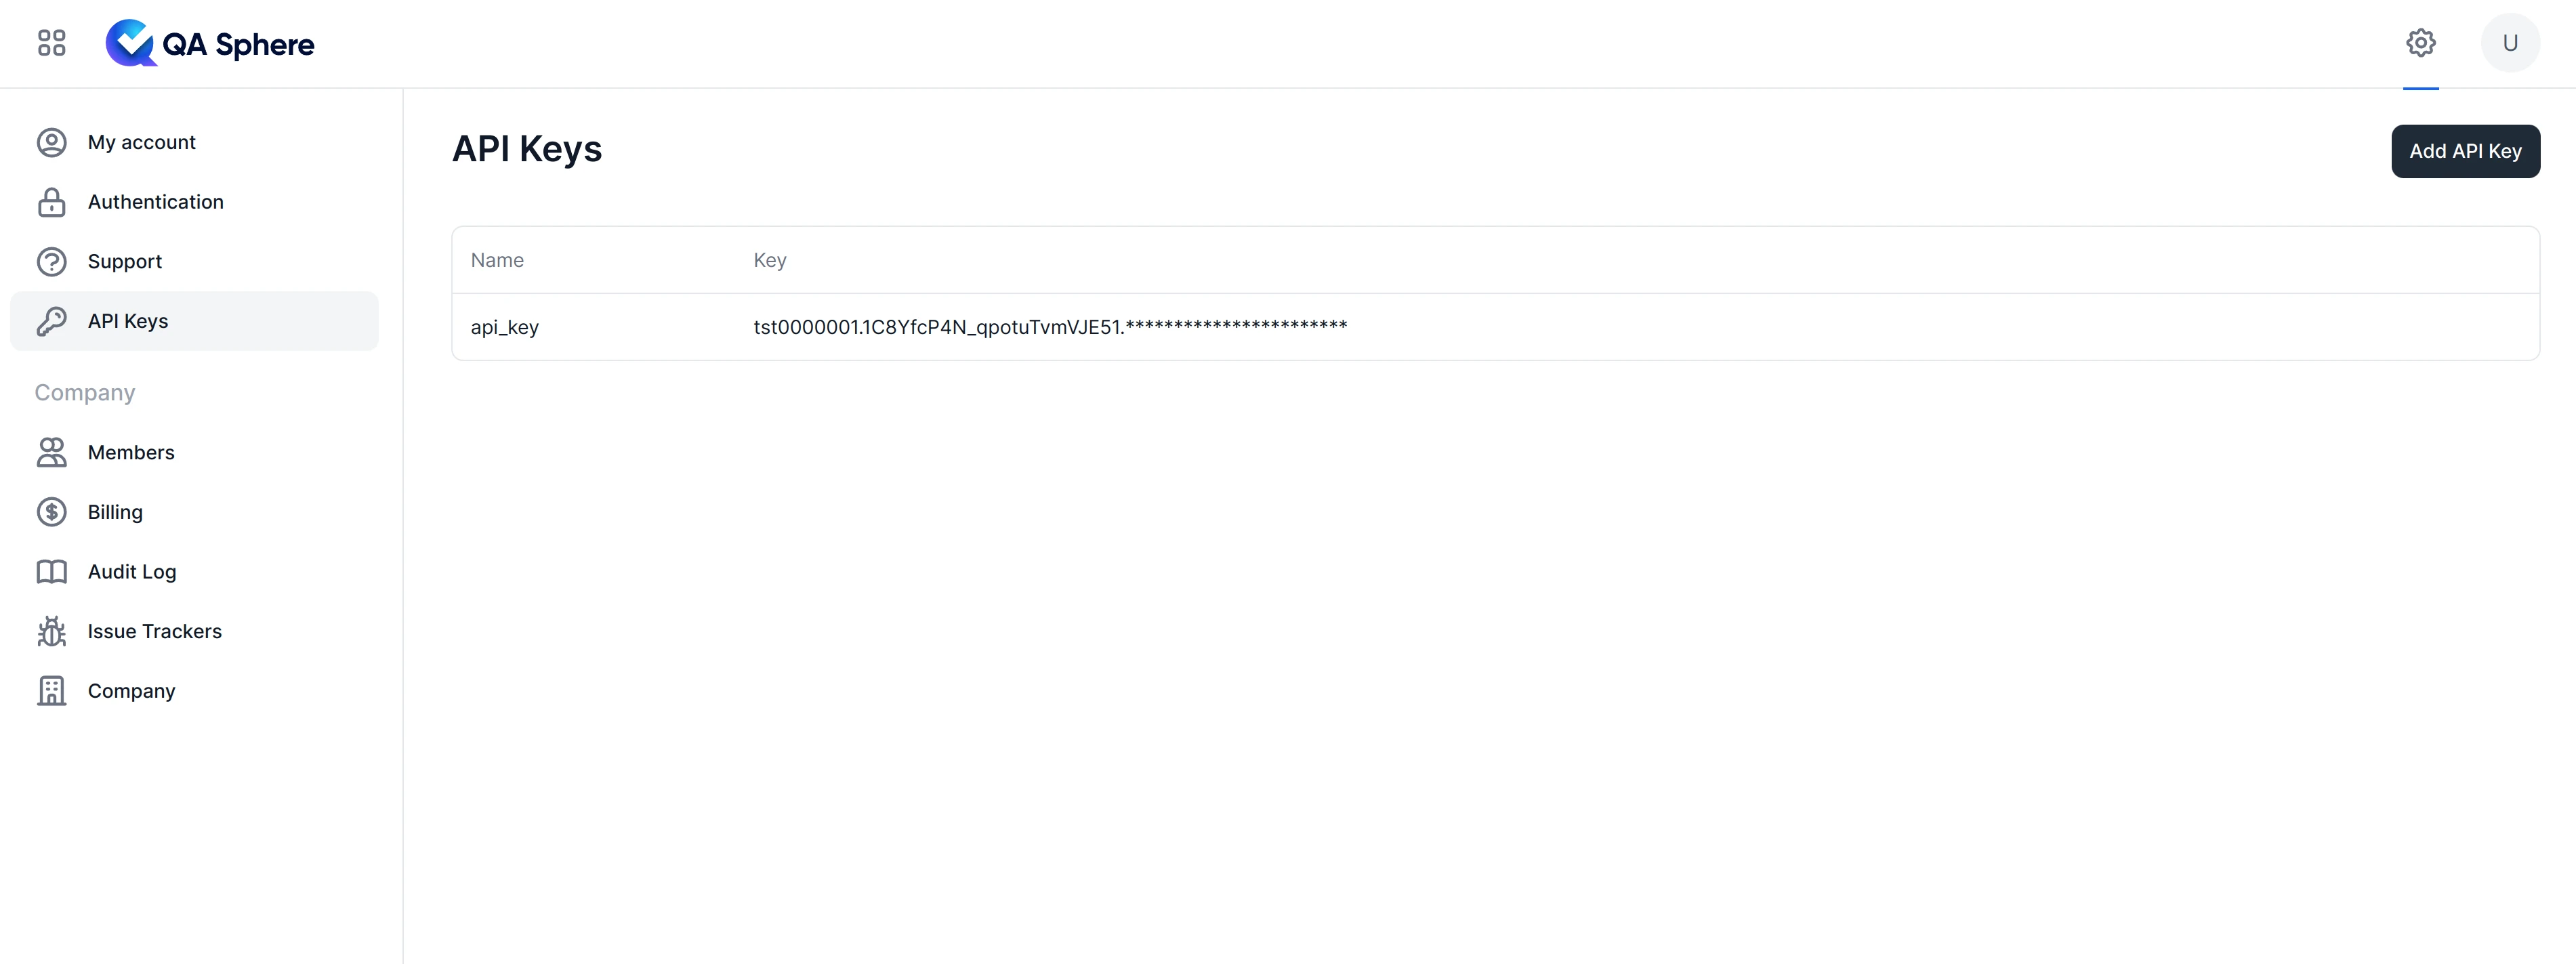
## Creating an API Key
1. Log into your QA Sphere account
2. Navigate to Settings
3. Select the API Keys section
4. Click "Add API Key"
5. Save your API key securely - you won't be able to see it again
## Restricted API Keys
API keys can be restricted to specific endpoints based on their name prefix. This follows the security principle of least-privilege access.
| Name Prefix | Allowed Endpoints | Use Case |
| --------------- | ------------------------------- | --------------------------- |
| `SIEM-LOG-ONLY` | `GET /api/public/v0/audit-logs` | SIEM audit log integrations |
For example, naming an API key `SIEM-LOG-ONLY-splunk` restricts it to only access the audit logs endpoint. Any attempt to access other endpoints will return `403 Forbidden`.
## Using Your API Key
### Request Headers
To authenticate your requests, send the API key in the `Authorization` header using the `Bearer` scheme:
```bash
curl \
-H "Authorization: Bearer your.api.key.here" \
https://your-company.your-region-code.qasphere.com/api/public/v0/project/BD/run/1/tcase
```
**Legacy format**
Earlier API keys were used with the `Authorization: ApiKey your.api.key.here` header. These are still supported for backward compatibility, but prefer the newer Bearer scheme for all integrations.
```bash
curl \
-H "Authorization: ApiKey your.api.key.here" \
https://your-company.your-region-code.qasphere.com/api/public/v0/project/BD/run/1/tcase
```
Never share your API key or commit it to version control. Use environment variables or secure secret management systems to store your API key.
## Error Responses
| Status Code | Scenario | Description |
| ----------- | ------------------------ | --------------------------------------------------------------------------------------------------- |
| 401 | Missing Authorization | No `Authorization` header in the request, or an unrecognized scheme |
| 401 | Invalid API Key Format | Malformed token |
| 401 | Invalid Credentials | The token was parsed but did not match any active API key, or the request host doesn't match tenant |
| 403 | Suspended Tenant or User | The tenant or the user that owns the API key is suspended |
| 403 | Network Access Denied | Request originated from an IP outside the tenant's allowlist (when configured) |
| 403 | Restricted Endpoint | An endpoint-restricted key (e.g. `SIEM-LOG-ONLY-*`) was used against a non-permitted endpoint |
## Best Practices
### DO
- Store API keys securely using environment variables or secret management systems
- Use different API keys for different environments (development, staging, production)
- Rotate API keys periodically
- Monitor API key usage for unusual patterns
- Include proper error handling for authentication failures
### DON'T
- Share API keys between different applications
- Commit API keys to version control
- Use production API keys in development environments
- Embed API keys directly in client-side code
- Use a single API key across multiple services
## Session Management
- API keys do not expire automatically
- The system tracks the last activity timestamp for each tenant
- Activity is updated when API calls are made (maximum once per 24 hours)
- Tenant suspension will invalidate all API keys for that tenant
## Troubleshooting
If you're experiencing authentication issues:
1. Verify the API key and authorization scheme
```
Authorization: Bearer your.api.key.here
```
The legacy `Authorization: ApiKey ` scheme is also accepted (see [Request Headers](#request-headers)).
2. Ensure your tenant account is not suspended
3. Verify you're using HTTPS for all API requests
4. Check the response headers for additional error information
If you need to regenerate an API key, you can do so from the QA Sphere web application settings. Remember to update all services using the old key.
---
# Audit Logs
URL: /docs/api/audit_logs
The audit logs endpoint allows administrators to retrieve security and activity events for compliance and monitoring purposes.
## List Audit Logs
`GET /api/public/v0/audit-logs`
Returns a paginated list of audit log events. This endpoint uses cursor-based pagination for efficient retrieval of large datasets.
### Authentication
Requires an API key with Admin role permissions. See [Authentication](https://qasphere.com/docs/api/authentication) for more details.
### Restricted API Keys
You can create API keys that are restricted to only access this endpoint by naming them with the `SIEM-LOG-ONLY` prefix. This is useful for SIEM integrations or third-party services that only need audit log access.
For example, an API key named `SIEM-LOG-ONLY-splunk` or `SIEM-LOG-ONLY-datadog` will:
- Be allowed to access `GET /api/public/v0/audit-logs`
- Be blocked from accessing all other API endpoints (returns `403 Forbidden`)
This provides a security best practice of least-privilege access for audit log integrations.
### Subscription Requirements
This endpoint is only available on plans with the **Advanced Auth** feature (Business and Enterprise plans). Requests from tenants without this feature will receive a `402 Payment Required` response.
### Query Parameters
| Parameter | Type | Description | Default | Example |
| --------- | ------- | ------------------------------------------------------------------------- | ------- | ------------- |
| `after` | integer | Cursor for pagination. Returns events with an ID greater than this value. | `0` | `after=12345` |
| `count` | integer | Number of events to return per page. Accepted range: 1–1,000. | `100` | `count=250` |
### Response Format
Status: 200 OK
```typescript
{
after: number // Cursor value for next page (last event ID in this response)
count: number // Number of events returned in this response
events: Array<{
id: number // Unique event identifier
user: {
// User who performed the action (null for system events)
id: number // User ID
name: string // User's display name
email: string // User's email address
} | null
action: string // Action type (see Action Types below)
ip: string // IP address of the request
userAgent: string // User agent string
createdAt: string // ISO 8601 timestamp
meta?: object // Additional context about the action (see Action Types below)
}>
}
```
### Action Types
The `meta` field provides additional context about the action. It is omitted from the response when empty.
For authentication failure actions, `user` identifies the account associated with the attempted credential. It does not mean the request successfully authenticated as that user. The `reason` and `flow` meta fields describe why authentication failed and which authentication flow was involved.
| Action | Description | Meta Fields |
| ----------------------------------- | ------------------------------------------------------------------------------------------ | ------------------------------------------------------------------------------------------------------------------------------------------------------------------------------------------------------------------------------------------------------------------------------------------------------------------------------------------------------------------------------------------------------------------------------------------------------------------------------ |
| `2fa_disable` | TOTP disabled or a passkey removed | `method` (`totp` or `passkey`), `name` (passkey name, for `passkey` only) |
| `2fa_enable` | TOTP enabled or a passkey added | `method` (`totp` or `passkey`), `name` (passkey name, for `passkey` only) |
| `archive_project` | Project was archived | `project_id`, `project_code`, `project_title` |
| `auth.2fa_failed` | Two-factor authentication failed | `reason`, `flow` |
| `auth.api_key_failed` | API key authentication failed | `reason`, `flow`, `api_key_id`, `api_key_name` |
| `auth.google_login_failed` | Google login failed | `reason`, `flow` |
| `auth.ip_or_user_agent_changed` | IP address or user agent changed during session | |
| `auth.oauth_token_failed` | OAuth token authentication failed | `reason`, `flow`, `oauth_authorization_id` |
| `auth.other_sessions_revoked` | All other sessions were revoked | `count` (active, non-staff sessions revoked) |
| `auth.password_login_failed` | Password login failed | `reason`, `flow` |
| `auth.password_verification_failed` | Password verification failed | `reason`, `flow` |
| `auth.saml_login_failed` | SAML login failed | `reason`, `flow` |
| `auth.session_failed` | Session authentication failed | `reason`, `flow`, `source` |
| `auth.session_revoked` | Session was revoked | `session_id`, `ip`, and `user_agent` of the revoked session |
| `cancel_invite` | User invitation was cancelled | `invited_email`, `invited_role` |
| `delete_project` | Project was deleted | `project_id`, `project_code`, `project_title` |
| `email_change` | User changed their email address | `old` (previous email), `new` (new email) |
| `integration.created` | Issue tracker integration was created | `integration_id`, `integration_title`, `integration_type`, plus type-specific fields: `new_url` and `view_url` (custom), `account` (GitHub), `email` and `url` (Jira), `organization_key` (Linear) |
| `integration.deleted` | Issue tracker integration was deleted | `integration_id`, `integration_title`, `integration_type`, `linked_project_count` |
| `integration.project_linked` | Project was linked to an issue tracker integration | `integration_id`, `integration_title`, `integration_type`, `project_id`, `project_code`, `project_title`, plus relation-config fields per integration type: `github_repo` (GitHub), `jira_project_id` and `jira_project_name` (Jira), `linear_team_id` and `linear_team_name` (Linear). When the project was previously linked, the prior config is included with a `previous_` prefix (e.g., `previous_integration_id`, `previous_integration_title`, `previous_github_repo`) |
| `integration.project_unlinked` | Project was unlinked from an issue tracker integration | Same as `integration.project_linked` but without the `previous_` fields |
| `integration.updated` | Issue tracker integration configuration was updated | `integration_id`, `integration_title`, `integration_type`, plus only the fields that changed (from the same set as `integration.created`) |
| `invite_user` | User was invited to the organization | `invited_email`, `invited_role` |
| `login` | User logged in | |
| `logout` | User logged out | |
| `oauth.authorization_created` | OAuth authorization granted (e.g., for [QAS CLI](https://github.com/Hypersequent/qas-cli)) | `grant_type`, `client_id`, `authorization_id` |
| `oauth.authorization_revoked` | OAuth authorization revoked | `client_id`, `authorization_id` |
| `password_change` | User changed their password | |
| `password_reset` | Password was reset | |
| `register` | New user registered | |
| `request_password_reset` | Password reset was requested | |
| `scim.user_create` | User provisioned via SCIM | `userName`, `apiKeyId`, `externalId` (when set on the user) |
| `scim.user_deactivate` | User suspended via SCIM | Same as `scim.user_create` |
| `scim.user_reactivate` | User unsuspended via SCIM | Same as `scim.user_create` |
| `scim.user_update` | User attributes updated via SCIM | Same as `scim.user_create` |
| `slack_disconnect` | Slack workspace was disconnected | |
| `slack_install` | Slack workspace was connected | `team_id`, `team_name`, `domain` |
| `slack_link_user` | Slack user was linked to a QA Sphere user | `team_id`, `slack_user_id`, `source` (`oauth_install` when auto-linked during install) |
| `slack_subscribe` | Slack channel subscribed to project events | `team_id`, `channel_id`, `channel_name`, `project_id`, `project_code`, `event_types` |
| `slack_unlink_user` | Slack user was unlinked from a QA Sphere user | |
| `slack_unsubscribe` | Slack channel unsubscribed from project events | `team_id`, `channel_id`, `channel_name`, `project_id`, `project_code`, `event_types`, `remaining` |
| `unarchive_project` | Project was unarchived | `project_id`, `project_code`, `project_title` |
| `webhook.created` | Webhook was created | `webhook_id`, `webhook_name`, `endpoint`, `enabled`, `event_types`, `allow_all_projects`, `allowed_project_count` (when `allow_all_projects` is false). `secret`, `headers`, and `payload` appear as `****` when set (values are redacted) |
| `webhook.deleted` | Webhook was deleted | Same as `webhook.created` |
| `webhook.updated` | Webhook configuration was updated | `webhook_id`, `webhook_name`, plus only the fields that changed (from the same set as `webhook.created`; secret/headers/payload changes appear as `****`) |
### Example Request
```bash
curl \
-H "Authorization: ApiKey your.api.key.here" \
"https://your-company.your-region-code.qasphere.com/api/public/v0/audit-logs?count=50"
```
### Example Response
```json
{
"after": 156,
"count": 3,
"events": [
{
"id": 154,
"user": {
"id": 1,
"name": "John Doe",
"email": "john@example.com"
},
"action": "login",
"ip": "203.0.113.10",
"userAgent": "Mozilla/5.0 (Macintosh; Intel Mac OS X 10_15_7)",
"createdAt": "2025-01-28T10:30:00Z"
},
{
"id": 155,
"user": {
"id": 1,
"name": "John Doe",
"email": "john@example.com"
},
"action": "archive_project",
"ip": "203.0.113.10",
"userAgent": "Mozilla/5.0 (Macintosh; Intel Mac OS X 10_15_7)",
"createdAt": "2025-01-28T11:00:00Z",
"meta": {
"project_id": "1CKgJ5HMU_2apSDSQWRw6Ys",
"project_code": "PROJ",
"project_title": "My Project"
}
},
{
"id": 156,
"user": {
"id": 2,
"name": "Jane Smith",
"email": "jane@example.com"
},
"action": "email_change",
"ip": "203.0.113.11",
"userAgent": "Mozilla/5.0 (Windows NT 10.0; Win64; x64)",
"createdAt": "2025-01-28T12:00:00Z",
"meta": {
"old": "jane.old@example.com",
"new": "jane@example.com"
}
}
]
}
```
### Pagination
This endpoint uses cursor-based pagination for efficient retrieval:
1. Make an initial request without the `after` parameter to get the first page
2. Use the `after` value from the response as the `after` parameter for the next request
3. Continue until you receive fewer events than requested (end of data)
#### Pagination Example
```bash
# First page
curl -H "Authorization: ApiKey your.api.key.here" \
"https://your-company.your-region-code.qasphere.com/api/public/v0/audit-logs?count=100"
# Response: { "after": 100, "count": 100, "events": [...] }
# Second page (using after value from previous response)
curl -H "Authorization: ApiKey your.api.key.here" \
"https://your-company.your-region-code.qasphere.com/api/public/v0/audit-logs?after=100&count=100"
# Response: { "after": 156, "count": 56, "events": [...] }
# count < 100 indicates this is the last page
```
When `after` is 0 or omitted, the response starts from the first event of the current month. If no events exist for the current month, an empty result is returned. The `after` value in the response equals the input `after` value when there are no more events to return.
### Error Responses
| Status Code | Description |
| ----------- | --------------------------------------------- |
| 400 | Invalid parameters (e.g., count > 1000) |
| 401 | Invalid or missing API key |
| 402 | Subscription plan lacks Advanced Auth feature |
| 403 | Insufficient permissions (non-admin access) |
| 500 | Internal server error |
This endpoint enables you to:
- Monitor user authentication activity
- Track security-related changes (2FA, password changes)
- Audit project lifecycle events
- Integrate with SIEM systems for compliance
- Build custom security dashboards
---
# Folders
URL: /docs/api/folders
The folders endpoint allows you to retrieve the folder structure of test cases within a project.
## List Folders
`GET /api/public/v0/project/{project_id}/tcase/folders/paginated`
`/paginated` endpoints are transitional. In API v1, the base paths will return paginated responses and the `/paginated` suffix will be removed.
Returns a hierarchical list of all folders in the project. This endpoint is useful for getting folder IDs and understanding the test case organization structure.
### Path Parameters
- `project_id`: The project identifier (can be either the project code or UUID)
### Query Parameters
| Parameter | Type | Description | Default | Example |
| ----------- | ------ | ------------------------------------------------------------------------------------------------- | ------- | ----------------- |
| `offset` | number | Number of rows to skip before returning results. | `0` | `offset=10` |
| `limit` | number | Maximum number of items to return. Accepted range: 0–1,000. | `100` | `limit=10` |
| `sortField` | string | Field to sort by: `id`, `project_id`, `title`, `pos`, `parent_id`, `created_at`, or `updated_at`. | `pos` | `sortField=title` |
| `sortOrder` | string | Sort direction for `sortField`: `asc` or `desc`. | `asc` | `sortOrder=desc` |
### Example Request
#### Skip the first 10 folders and return the next 10 — or, return 10 folders starting from 0-based index 10
```bash
curl \
-H "Authorization: ApiKey your.api.key.here" \
https://company.qasphere.com/api/public/v0/project/BD/tcase/folders/paginated?offset=10&limit=10&sortField=title&sortOrder=desc
```
### Response
Status: 200 OK
```typescript
{
total: number, // Total number of folders
offset: number, // The page offset
limit: number, // The page limit
data: Array<{ // List of folders in the page
id: number // Unique identifier for the folder
title: string // Name of the folder
comment: html // Additional notes or description
pos: number // Position of the folder among its siblings
parentId: number // ID of the parent folder (0 for root folders)
projectId: string // ID of the project the folder belongs to
}>
}
```
### Example Response
```json
{
"total": 12,
"offset": 0,
"limit": 2,
"data": [
{
"id": 11866,
"parentId": 11844,
"title": "Welcome",
"comment": "",
"projectId": "1CGeNZsqU_BRPFrugwAVDs3",
"pos": 4
},
{
"id": 11855,
"parentId": 11844,
"title": "Today's menu",
"comment": "",
"projectId": "1CGeNZsqU_BRPFrugwAVDs3",
"pos": 3
}
]
}
```
### Error Responses
| Status Code | Description |
| ----------- | -------------------------------------------- |
| 401 | Invalid or missing API key |
| 403 | Insufficient permissions or suspended tenant |
| 404 | Project not found |
Use the folder IDs returned by this endpoint when creating or updating test runs to specify which folders should be included in the run.
## List Folders (Deprecated)
**Deprecated**
This endpoint is deprecated. Use [List Folders](#list-folders) (`GET /api/public/v0/project/{project_id}/tcase/folders/paginated`) instead.
`GET /api/public/v0/project/{project_id}/tcase/folders`
Returns a hierarchical list of all folders in the project. This endpoint is useful for getting folder IDs and understanding the test case organization structure.
### Path Parameters
- `project_id`: The project identifier (can be either the project code or UUID)
### Query Parameters
| Parameter | Type | Description | Example |
| ----------- | ------ | ------------------------------------------------------------------------------------------------------------------------------------------------- | ----------------- |
| `offset` | number | Number of rows to skip before returning results. Combine with `limit` for offset-based pagination. | `offset=10` |
| `limit` | number | Maximum number of items to return (0–5000). May be `0` to return only the total count (no rows). | `limit=10` |
| `page` | number | **Deprecated** — use `offset` instead. 1-based page number. Ignored when `offset` is set. If `limit` is omitted, a default of 10 is applied. | `page=1` |
| `sortField` | string | Field to sort by. Allowed values: - `id` - `project_id` - `title` - `pos` - `parent_id` - `created_at` - `updated_at` | `sortField=title` |
| `sortOrder` | string | Sort direction (requires `sortField`). Allowed values: `asc`, `desc` | `sortOrder=desc` |
### Example Request
#### Skip the first 10 folders and return the next 10 — or, return 10 folders starting from 0-based index 10
```bash
curl \
-H "Authorization: ApiKey your.api.key.here" \
https://company.qasphere.com/api/public/v0/project/BD/tcase/folders?offset=10&limit=10&sortField=title&sortOrder=desc
```
### Response
Status: 200 OK
```typescript
{
total: number, // Total number of items available
offset?: number, // The offset that was applied (present when pagination was applied)
limit?: number, // The limit that was applied (present when pagination was applied)
page?: number, // **Deprecated**. Echo of the page that was requested (present only if `page` was used in the request)
data: Array<{ // Array of folder objects
id: number // Unique identifier for the folder
title: string // Name of the folder
comment: html // Additional notes or description
pos: number // Position of the folder among its siblings
parentId: number // ID of the parent folder (0 for root folders)
projectId: string // ID of the project the folder belongs to
}>
}
```
### Example Response
```json
{
"total": 12,
"offset": 0,
"limit": 2,
"data": [
{
"id": 11866,
"parentId": 11844,
"title": "Welcome",
"comment": "",
"projectId": "1CGeNZsqU_BRPFrugwAVDs3",
"pos": 4
},
{
"id": 11855,
"parentId": 11844,
"title": "Today's menu",
"comment": "",
"projectId": "1CGeNZsqU_BRPFrugwAVDs3",
"pos": 3
}
]
}
```
### Error Responses
| Status Code | Description |
| ----------- | -------------------------------------------- |
| 401 | Invalid or missing API key |
| 403 | Insufficient permissions or suspended tenant |
| 404 | Project not found |
Use the folder IDs returned by this endpoint when creating or updating test runs to specify which folders should be included in the run.
## Bulk Upsert Folders
`POST /api/public/v0/project/{project_id}/tcase/folder/bulk`
Creates or updates multiple folders in a single request using folder path hierarchies. This endpoint automatically creates nested folder structures and updates existing folders' comments.
### Path Parameters
- `project_id`: The project identifier (can be either the project code or UUID)
### Request Body
```typescript
{
folders: Array<{
path: string[] // Array of folder names representing the hierarchy
comment?: html // Additional notes or description for the leaf folder.
}>
}
```
### Response
Status: 200 OK
```typescript
{
ids: Array> // Each array represents the full folder path hierarchy in the request as an array of folder IDs, from root to leaf
}
```
**Details:**
- The `ids` field is an array where each item corresponds to one input folder path.
- Each inner array contains folder IDs that map 1:1 to the specified folder path in the request.
- For example, if your path is `["Frontend", "Components", "Navigation"]`, the result could be `[12, 13, 14]` where `12` is "Frontend", `13` is "Components", `14` is "Navigation".
- Newly created folders will always get new IDs; existing folders return their original IDs.
- The order of returned arrays matches the order of the input `folders` in the request.
### Example Request
```bash
curl -X POST \
-H "Authorization: ApiKey your.api.key.here" \
-H "Content-Type: application/json" \
-d '{
"folders": [
{
"path": ["Frontend", "Components", "Navigation"],
"comment": "
"
}
]
}' \
https://company.qasphere.com/api/public/v0/project/BD/tcase/folder/bulk
```
### Example Response
Status: 200 OK
```json
{
"ids": [
[12, 13, 14],
[12, 13, 15],
[16, 17, 18]
]
}
```
### Behavior
- **Creates nested structure**: Automatically creates all parent folders in the path if they don't exist
- **Updates existing folders**: If a folder path already exists, only the comment is updated
- **Idempotent**: Running the same request multiple times produces the same result
- **Preserves hierarchy**: Maintains proper parent-child relationships between folders
- **Position assignment**: New folders are positioned automatically within their parent
### Example Folder Creation
Given the request above, the following folder structure would be created:
```
Frontend/
├── Components/
│ ├── Navigation/ (comment: "Tests for navigation components")
│ └── Forms/ (comment: "Form validation and interaction tests")
Backend/
└── API/
└── Authentication/ (comment: "Authentication endpoint tests")
```
### Error Responses
| Status Code | Description |
| ----------- | -------------------------------------------- |
| 400 | Invalid request body or folder path format |
| 401 | Invalid or missing API key |
| 403 | Insufficient permissions or suspended tenant |
| 404 | Project not found |
| 500 | Internal server error |
### Validation Rules
- Each folder name in the path must be 1-255 characters long
- Folder names cannot be empty strings
- The `path` array cannot be empty
- folder comment should be in html format
This endpoint is particularly useful for:
- Setting up folder structures during project initialization
- Bulk importing test case organization from external systems
- Synchronizing folder structures across projects
- Automating test case creation
The endpoint only updates the `comment` field for existing folders. Other properties like position and parent relationships are preserved.
---
# Milestones
URL: /docs/api/milestone
The milestones endpoint allows you to retrieve all milestones associated with a project. Milestones help organize and track test runs across different versions or phases of your project.
## List Milestones
`GET /api/public/v0/project/{project_id}/milestone/paginated`
`/paginated` endpoints are transitional. In API v1, the base paths will return paginated responses and the `/paginated` suffix will be removed.
Returns a list of all milestones in the project. This endpoint is particularly useful when you need milestone IDs for creating or cloning test runs.
### Path Parameters
- `project_id`: The project identifier (can be either the project code or UUID)
### Query Parameters
| Parameter | Type | Description | Default | Example |
| ----------- | ------ | ------------------------------------------------------------------------ | ------------ | ----------------- |
| `archived` | bool | Filter milestones by archived state. | No filter | `archived=true` |
| `offset` | number | Number of rows to skip before returning results. | `0` | `offset=10` |
| `limit` | number | Maximum number of rows to return. Accepted range: 0–1,000. | `100` | `limit=20` |
| `sortField` | string | Field to sort by: `title`, `created_at`, `updated_at`, or `archived_at`. | `created_at` | `sortField=title` |
| `sortOrder` | string | Sort direction for `sortField`: `asc` or `desc`. | `asc` | `sortOrder=asc` |
### Response
Status: 200 OK
```typescript
{
total: number, // Total number of milestones
offset: number, // The page offset
limit: number, // The page limit
data: Array<{ // List of milestones in the page
id: number // Unique identifier for the milestone
title: string // Name of the milestone
createdAt: string // Creation timestamp in ISO 8601 format
updatedAt: string // Last update timestamp in ISO 8601 format
archivedAt: string | null // Timestamp when the milestone was archived in ISO 8601 format
}>
}
```
### Example Request
#### Fetch all milestones
```bash
curl \
-H "Authorization: ApiKey your.api.key.here" \
https://your-company.your-region-code.qasphere.com/api/public/v0/project/BD/milestone/paginated
```
#### Fetch only non-archived milestones
```bash
curl \
-H "Authorization: ApiKey your.api.key.here" \
https://your-company.your-region-code.qasphere.com/api/public/v0/project/BD/milestone/paginated?archived=false
```
### Example Response
```json
{
"total": 2,
"offset": 0,
"limit": 100,
"data": [
{
"id": 1,
"title": "Version 0.9",
"createdAt": "2024-01-01T00:00:00.000Z",
"updatedAt": "2024-01-01T00:00:00.000Z",
"archivedAt": null
},
{
"id": 2,
"title": "Version 1.0",
"createdAt": "2024-01-01T00:00:00.000Z",
"updatedAt": "2024-01-01T00:00:00.000Z",
"archivedAt": "2024-02-01T00:00:00.000Z"
}
]
}
```
### Error Responses
| Status Code | Description |
| ----------- | ---------------------------------------------- |
| 401 | Invalid or missing API key |
| 403 | Insufficient permissions or suspended tenant |
| 404 | Project not found |
| 500 | Internal server error during milestone listing |
## List Milestones (Deprecated)
**Deprecated**
This endpoint is deprecated. Use [List Milestones](#list-milestones) (`GET /api/public/v0/project/{project_id}/milestone/paginated`) instead.
`GET /api/public/v0/project/{project_id}/milestone`
Returns a list of all milestones in the project. This endpoint is particularly useful when you need milestone IDs for creating or cloning test runs.
### Path Parameters
- `project_id`: The project identifier (can be either the project code or UUID)
### Query Parameters
| Parameter | Type | Description | Example |
| ---------- | ---- | ------------------------------------------- | --------------- |
| `archived` | bool | Fetch only archived/non-archived milestones | `archived=true` |
### Response
Status: 200 OK
```typescript
{
milestones: Array<{
// Array of milestone objects
id: number // Unique identifier for the milestone
title: string // Name of the milestone
createdAt: string // Creation timestamp in ISO 8601 format
updatedAt: string // Last update timestamp in ISO 8601 format
archivedAt: string | null // Timestamp when the milestone was archived in ISO 8601 format
}>
}
```
### Example Request
#### Fetch all milestones
```bash
curl \
-H "Authorization: ApiKey your.api.key.here" \
https://your-company.your-region-code.qasphere.com/api/public/v0/project/BD/milestone
```
#### Fetch only non-archived milestones
```bash
curl \
-H "Authorization: ApiKey your.api.key.here" \
https://your-company.your-region-code.qasphere.com/api/public/v0/project/BD/milestone?archived=false
```
### Example Response
```json
{
"milestones": [
{
"id": 1,
"title": "Version 0.9",
"createdAt": "2024-01-01T00:00:00.000Z",
"updatedAt": "2024-01-01T00:00:00.000Z",
"archivedAt": null
},
{
"id": 2,
"title": "Version 1.0",
"createdAt": "2024-01-01T00:00:00.000Z",
"updatedAt": "2024-01-01T00:00:00.000Z",
"archivedAt": "2024-02-01T00:00:00.000Z"
}
]
}
```
### Error Responses
| Status Code | Description |
| ----------- | ---------------------------------------------- |
| 401 | Invalid or missing API key |
| 403 | Insufficient permissions or suspended tenant |
| 404 | Project not found |
| 500 | Internal server error during milestone listing |
## Create Milestone
`POST /api/public/v0/project/{project_id}/milestone`
Creates a new milestone in the project. Milestones help organize test runs by version or project phase.
### Authentication
Requires an API key with at least Test Runner role permissions. See [Authentication](https://qasphere.com/docs/api/authentication) for more details.
### Path Parameters
- `project_id`: The project identifier (can be either the project code or UUID)
### Request Body
```typescript
{
title: string // Required: Name of the milestone (max 255 chars)
}
```
### Response
Status: 201 Created
```typescript
{
id: number // The ID of the newly created milestone
}
```
### Example Request
#### Using cURL
```bash
curl \
-X POST \
-H "Authorization: ApiKey your.api.key.here" \
-H "Content-Type: application/json" \
-d '{
"title": "Version 2.0"
}' \
https://your-company.your-region-code.qasphere.com/api/public/v0/project/BD/milestone
```
#### Request Body (JSON)
```json
{
"title": "Version 2.0"
}
```
#### Minimal Request Example
```json
{
"title": "Quick Fix Release"
}
```
### Example Response
```json
{
"id": 42
}
```
### Validation Rules
- **Title**: Required, must be unique within the project, maximum 255 characters
### Error Responses
| Status Code | Description |
| ----------- | ----------------------------------------------- |
| 400 | Invalid request body or validation error |
| 401 | Invalid or missing API key |
| 403 | Duplicate milestone title exists in the project |
| 404 | Project not found |
| 500 | Internal server error during milestone creation |
After creating a milestone, you can use its ID when creating test runs to associate them with this specific project version or phase.
---
# Test Plans
URL: /docs/api/plan
The plans endpoints allow you to create and manage test plans in your project. A test plan is a collection of test runs that are organized and executed together, typically for a specific milestone or release. Write operations (create/update/delete) can only be performed by users with role test runner or with higher privileges.
## Test Plan Overview
A test plan consists of:
- **Title and Description**: Basic information about the plan
- **Milestone**: Optional association with a project milestone
- **Runs**: One or more test runs, each containing a set of test cases
Each run within a plan:
- Has its own title
- Can be assigned to a specific user
- Can be associated with a configuration
- Contains exactly one query plan that specifies the test cases to include
## Create New Test Plan
`POST /api/public/v0/project/{project_id}/plan`
Creates a new test plan in the project with one or more test runs.
### Authentication
Requires an API key with at least Test Runner role permissions. See [Authentication](https://qasphere.com/docs/api/authentication) for more details.
### Request Body
```typescript
{
title: string // Required: Plan title (max 255 characters)
description?: html // Optional: Plan description
milestoneId?: number // Optional: Associated milestone
runs: Array<{ // Required: List of runs in the plan
title: string // Required: Run title (max 255 characters)
assignmentId?: number // Optional: Assigned user ID
configurationId?: string // Optional: Configuration ID
queryPlans: Array<{ // Required: Exactly one query plan per run
tcaseIds: Array // Required: Test case IDs to include
}>
}>
}
```
**Field Constraints**
- `title`: Must be 1-255 characters long and unique within the milestone (or among plans without milestones)
- `description`: HTML content that will be sanitized
- `milestoneId`: The milestone must belong to the project and must not be archived
- `runs`: Must contain at least one run
- Each run must have exactly one query plan
- `tcaseIds`: Must be valid test case IDs belonging to the project
- `assignmentId`: Must be an active user with permissions above Viewer role
- Test case IDs must be standalone or filled types (not templates)
### Response
Status: 201 Created
```json
{
"id": 5
}
```
The response contains the ID of the newly created test plan.
### Error Responses
| Status Code | Description |
| ----------- | ---------------------------------------------------- |
| 400 | Invalid request data or validation errors |
| 401 | Invalid or missing API key |
| 403 | Insufficient permissions (requires Test Runner role) |
| 404 | Project not found |
| 409 | Conflict - Plan title already exists in milestone |
| 500 | Internal server error |
## Common Use Cases
### Cross-Browser Testing
Create a test plan to run the same test suite across different browsers:
```json
{
"title": "Release 3.0 Browser Compatibility",
"description": "
Test plan for different components developed in Sprint 23
",
"runs": [
{
"title": "User Authentication Module",
"assignmentId": 3,
"queryPlans": [{ "tcaseIds": ["1CEPaUhgH_Tvt2LZygwVRQa", "1CAPaUhgH_Tvt2LZygwVRTb"] }]
},
{
"title": "Payment Processing Module",
"assignmentId": 4,
"queryPlans": [{ "tcaseIds": ["1EEPaUhgH_Tvt2LZygwVRLm", "1FEPaUhgH_Tvt2LZygwVRNn"] }]
},
{
"title": "Notification Service",
"assignmentId": 5,
"queryPlans": [{ "tcaseIds": ["1GEPaUhgH_Tvt2LZygwVROo", "1HEPaUhgH_Tvt2LZygwVRPp"] }]
}
]
}
```
**Best Practices**
- **Configuration-Based Runs**: Most test plans will have runs with similar titles and identical test cases, differing only in configurations (e.g., browsers, devices, environments)
- **Consistent Naming**: Use a consistent naming pattern for runs testing the same functionality across configurations (e.g., "Feature X - Chrome", "Feature X - Firefox")
- **Same Test Cases**: Reuse the same test case IDs across runs when testing across different configurations
- **Assign by Expertise**: When testing across platforms, assign runs based on platform expertise rather than feature expertise
- **Link to Milestones**: Associate plans with milestones for better release tracking
- **Exception Cases**: Only create runs with different test cases when testing distinct components or modules
**Limitations**
- Each run must have exactly one query plan
- Only User selection test runs are supported (tcaseIds must be specified). See [Types of Runs](https://qasphere.com/docs/api/run#types-of-runs) for more details.
- Dynamic folder/tag-based selection is not available for plans
- Test plans cannot be cloned via the public API (planned for future release)
- Updating test plans is not yet available via the public API
## Related Resources
- [Runs](https://qasphere.com/docs/api/run) - Learn about individual test runs
- [Test Cases](https://qasphere.com/docs/api/tcases) - Manage test cases
- [Milestones](https://qasphere.com/docs/api/milestone) - Work with project milestones
- [Results](https://qasphere.com/docs/api/result) - Add results to test cases in runs
---
# Projects
URL: /docs/api/projects
The projects endpoint allows you to retrieve projects in your account.
## Authentication
Project visibility will depend if the user has proper access to the project. If you are the owner or an admin, you may grant access to users to a project
by going to your QA Sphere account, then go to the Members page in settings to grant access to the user.
## List Projects
`GET /api/public/v0/project/paginated`
`/paginated` endpoints are transitional. In API v1, the base paths will return paginated responses and the `/paginated` suffix will be removed.
Returns a list of all projects.
### Query Parameters
| Parameter | Type | Description | Default | Example |
| ----------- | ------ | ----------------------------------------------------------------- | --------- | ----------------- |
| `archived` | bool | Filter projects by archived state. | No filter | `archived=false` |
| `offset` | number | Number of rows to skip before returning results. | `0` | `offset=10` |
| `limit` | number | Maximum number of rows to return. Accepted range: 0–1,000. | `100` | `limit=20` |
| `sortField` | string | Field to sort by: `code`, `title`, `created_at`, or `updated_at`. | `title` | `sortField=title` |
| `sortOrder` | string | Sort direction for `sortField`: `asc` or `desc`. | `asc` | `sortOrder=asc` |
### Response
Status: 200 OK
```typescript
{
total: number, // Total number of projects
offset: number, // The page offset
limit: number, // The page limit
data: Array<{ // List of projects in the page
id: string // Unique identifier for the project
code: string // User specified unique identifier for the project
title: string // Name of the project
description: html // Description of the project (Deprecated: use overviewDescription)
overviewTitle: string // Overview title shown in overview page of the project
overviewDescription: html // Overview description shown in overview page of the project
links: Array<{ // A list of links that is shown in the overview page of the project
url: string // URL of the link
text: string // Displayed text of the link
}>
createdAt: Date // Date when the project is created
updatedAt: Date // Date when project information was last updated
archivedAt: Date | null // Date when the project has been archived
}>
}
```
### Example Request
```bash
curl \
-H "Authorization: ApiKey your.api.key.here" \
https://your-company.your-region-code.qasphere.com/api/public/v0/project/paginated
```
### Example Response
```json
{
"total": 1,
"offset": 0,
"limit": 100,
"data": [
{
"id": "1CJo8oDjj_vkGo2rQAdzz4F",
"code": "BD",
"title": "Bistro Delivery",
"description": "
Welcome to the Bistro Delivery example project. This project showcases a typical food ordering website with features like a menu, shopping cart, and order process. We've included basic test cases, organized by type, tags, and priorities, along with test runs to demonstrate how QA Sphere can streamline your testing workflow.
Welcome to the Bistro Delivery example project. This project showcases a typical food ordering website with features like a menu, shopping cart, and order process. We've included basic test cases, organized by type, tags, and priorities, along with test runs to demonstrate how QA Sphere can streamline your testing workflow.
",
"links": [
{
"text": "Bistro Delivery Site",
"url": "https://hypersequent.github.io/bistro/"
},
{
"text": "Automation Tests",
"url": "https://github.com/Hypersequent/bistro-e2e"
},
{
"text": "QA Sphere CLI Tool",
"url": "https://github.com/Hypersequent/qas-cli"
}
],
"createdAt": "2025-01-02T11:41:19.547371+04:00",
"updatedAt": "2025-01-02T11:41:19.547371+04:00",
"archivedAt": null
}
]
}
```
### Error Responses
| Status Code | Description |
| ----------- | -------------------------------------------- |
| 500 | Internal server error during project listing |
## List Projects (Deprecated)
**Deprecated**
This endpoint is deprecated. Use [List Projects](#list-projects) (`GET /api/public/v0/project/paginated`) instead.
`GET /api/public/v0/project`
Returns a list of all projects.
### Response
Status: 200 OK
```typescript
{
projects: Array<{
// A list of projects
id: string // Unique identifier for the project
code: string // User specified unique identifier for the project
title: string // Name of the project
description: html // Description of the project (Deprecated: use overviewDescription)
overviewTitle: string // Overview title shown in overview page of the project
overviewDescription: html // Overview description shown in overview page of the project
links: Array<{
// A list of links that is shown in the overview page of the project
url: string // URL of the link
text: string // Displayed text of the link
}>
createdAt: Date // Date when the project is created
updatedAt: Date // Date when project information was last updated
archivedAt: Date | null // Date when the project has been archived
}>
}
```
### Example Request
```bash
curl \
-H "Authorization: ApiKey your.api.key.here" \
https://your-company.your-region-code.qasphere.com/api/public/v0/project
```
### Example Response
```json
{
"projects": [
{
"id": "1CJo8oDjj_vkGo2rQAdzz4F",
"code": "BD",
"title": "Bistro Delivery",
"description": "
Welcome to the Bistro Delivery example project. This project showcases a typical food ordering website with features like a menu, shopping cart, and order process. We've included basic test cases, organized by type, tags, and priorities, along with test runs to demonstrate how QA Sphere can streamline your testing workflow.
Welcome to the Bistro Delivery example project. This project showcases a typical food ordering website with features like a menu, shopping cart, and order process. We've included basic test cases, organized by type, tags, and priorities, along with test runs to demonstrate how QA Sphere can streamline your testing workflow.
",
"links": [
{
"text": "Bistro Delivery Site",
"url": "https://hypersequent.github.io/bistro/"
},
{
"text": "Automation Tests",
"url": "https://github.com/Hypersequent/bistro-e2e"
},
{
"text": "QA Sphere CLI Tool",
"url": "https://github.com/Hypersequent/qas-cli"
}
],
"createdAt": "2025-01-02T11:41:19.547371+04:00",
"updatedAt": "2025-01-02T11:41:19.547371+04:00",
"archivedAt": null
}
]
}
```
### Error Responses
| Status Code | Description |
| ----------- | -------------------------------------------- |
| 500 | Internal server error during project listing |
## Get Project
`GET /api/public/v0/project/{project_code_or_id}`
Returns the project identified by code or id.
### Response
Status: 200 OK
```typescript
{
id: string // Unique identifier for the project
code: string // User specified unique identifier for the project
title: string // Name of the project
description: html // Description of the project (Deprecated: use overviewDescription)
overviewTitle: string // Overview title shown in overview page of the project
overviewDescription: html // Overview description shown in overview page of the project
links: Array<{
// A list of links that is shown in the overview page of the project
url: string // URL of the link
text: string // Displayed text of the link
}>
createdAt: Date // Date when the project is created
updatedAt: Date // Date when project information was last updated
archivedAt: Date | null // Date when the project has been archived
}
```
### Example Request
```bash
curl \
-H "Authorization: ApiKey your.api.key.here" \
https://your-company.your-region-code.qasphere.com/api/public/v0/project/BD
```
### Example Response
```json
{
"id": "1CJo8oDjj_vkGo2rQAdzz4F",
"code": "BD",
"title": "Bistro Delivery",
"description": "
Welcome to the Bistro Delivery example project. This project showcases a typical food ordering website with features like a menu, shopping cart, and order process. We've included basic test cases, organized by type, tags, and priorities, along with test runs to demonstrate how QA Sphere can streamline your testing workflow.
Welcome to the Bistro Delivery example project. This project showcases a typical food ordering website with features like a menu, shopping cart, and order process. We've included basic test cases, organized by type, tags, and priorities, along with test runs to demonstrate how QA Sphere can streamline your testing workflow.
",
"links": [
{
"text": "Bistro Delivery Site",
"url": "https://hypersequent.github.io/bistro/"
},
{
"text": "Automation Tests",
"url": "https://github.com/Hypersequent/bistro-e2e"
},
{
"text": "QA Sphere CLI Tool",
"url": "https://github.com/Hypersequent/qas-cli"
}
],
"createdAt": "2025-01-02T11:41:19.547371+04:00",
"updatedAt": "2025-01-02T11:41:19.547371+04:00",
"archivedAt": null
}
```
### Error Responses
| Status Code | Description |
| ----------- | --------------------------------------------- |
| 403 | User has no permission to access project |
| 404 | Project not found |
| 500 | Internal server error during project fetching |
## Create Project
`POST /api/public/v0/project`
Creates a new project. Only users with role Admin or Owner are allowed to create a project.
### Request Body
```typescript
{
code: string // Unique project code (2-5 alphanumeric characters)
title: string // Name of the project (max 255 characters)
links?: Array<{ // Optional list of links for the project overview
url: string // URL of the link (max 255 characters)
text: string // Displayed text of the link (max 255 characters)
}>
overviewTitle?: string // Optional overview title (max 255 characters)
overviewDescription?: html // Optional overview description
}
```
### Example Request
```bash
curl -X POST \
-H "Authorization: ApiKey your.api.key.here" \
-H "Content-Type: application/json" \
-d '{
"code": "BD",
"title": "Bistro Delivery",
"links": [
{"url": "https://hypersequent.github.io/bistro/", "text": "Bistro Delivery Site"},
{"url": "https://github.com/Hypersequent/bistro-e2e", "text": "Automation Tests"}
],
"overviewTitle": "Bistro Delivery - Example",
"overviewDescription": "
Welcome to the Bistro Delivery example project. This project showcases a typical food ordering website with features like a menu, shopping cart, and order process.
"
}' \
https://your-company.your-region-code.qasphere.com/api/public/v0/project
```
### Response Fields
```typescript
{
id: string // Unique identifier for the project
}
```
### Example Response
Status: 201 Created
```json
{
"id": "1CJo8oDjj_vkGo2rQAdzz4F"
}
```
### Error Responses
| Status Code | Description |
| ----------- | --------------------------------------------- |
| 400 | Invalid project code format |
| 403 | User does not have admin permission |
| 409 | Project with the same title already exists |
| 500 | Internal server error during project creation |
---
# Requirements
URL: /docs/api/requirements
The requirements endpoints allow you to retrieve requirements that are linked to test cases within a project. Requirements help track traceability between test cases and external specifications, user stories, or other documentation.
## About Requirements
Requirements are references to external documentation or specifications that test cases are designed to verify. They consist of:
1. **Text**: A descriptive label for the requirement (1-255 characters)
2. **URL** (optional): A link to the external requirement document or issue tracker
Requirements can be linked to multiple test cases, and a single test case can be linked to multiple requirements. This enables full traceability between your tests and the specifications they validate.
- Requirements can be linked to external issues when a Jira or Linear integration is configured for the project
- Use `include=tcaseCount` to see how many test cases are linked to each requirement
- Requirements without any linked test cases are still returned in the list
## List Requirements
`GET /api/public/v0/project/{project_id}/requirement/paginated`
`/paginated` endpoints are transitional. In API v1, the base paths will return paginated responses and the `/paginated` suffix will be removed.
Retrieves all requirements within a project, optionally sorted and with additional fields included.
### Path Parameters
- `project_id`: The project identifier (can be either the project code or UUID)
### Query Parameters
| Parameter | Type | Description | Default | Example |
| ----------- | ------ | --------------------------------------------------------------------------- | ------- | -------------------- |
| `offset` | number | Number of rows to skip before returning results. | `0` | `offset=10` |
| `limit` | number | Maximum number of rows to return. Accepted range: 0–1,000. | `100` | `limit=20` |
| `sortField` | string | Field to sort by: `created_at` or `text`. | `text` | `sortField=text` |
| `sortOrder` | string | Sort direction for `sortField`: `asc` or `desc`. | `asc` | `sortOrder=asc` |
| `include` | string | Include additional fields omitted by default. Accepted value: `tcaseCount`. | None | `include=tcaseCount` |
- Use `include=tcaseCount` to see how many test cases are linked to each requirement
- Sorting by `created_at` shows the most recently created requirements first (with `desc`) or oldest first (with `asc`)
- Sorting by `text` provides alphabetical ordering
### Example Request
#### Fetch all requirements
```bash
curl \
-H "Authorization: ApiKey your.api.key.here" \
https://your-company.your-region-code.qasphere.com/api/public/v0/project/BD/requirement/paginated
```
#### Fetch all requirements sorted by text in ascending order
```bash
curl \
-H "Authorization: ApiKey your.api.key.here" \
https://your-company.your-region-code.qasphere.com/api/public/v0/project/BD/requirement/paginated?sortField=text&sortOrder=asc
```
#### Fetch all requirements with test case count included
```bash
curl \
-H "Authorization: ApiKey your.api.key.here" \
https://your-company.your-region-code.qasphere.com/api/public/v0/project/BD/requirement/paginated?include=tcaseCount
```
### Response Fields
```typescript
{
total: number, // Total number of requirements
offset: number, // The page offset
limit: number, // The page limit
data: Array<{ // List of requirements in the page
id: string // Unique identifier of the requirement (HQID7 format)
text: string // Descriptive label for the requirement
url: string // URL to the external requirement document (empty string if not set)
integrationLink?: { // Integration link (only present if linked to Jira or Linear)
type: string // Integration type ("jira" or "linear")
integrationId: string // ID of the integration configuration
issueId: string // Internal issue ID (Jira numeric ID or Linear UUID)
issueTitle: string // Title of the linked issue
issueUrl: string // Full URL to the linked issue
remoteLinkId: string // Remote link/attachment ID in the external system
}
tcaseCount?: number // Number of test cases linked to this requirement (only included if requested)
}>
}
```
### Example Response
```json
{
"total": 3,
"offset": 0,
"limit": 100,
"data": [
{
"id": "1CKgJ5HMU_1VQTDrRJDdDVW",
"text": "User Authentication",
"url": "https://docs.example.com/specs/auth",
"tcaseCount": 5
},
{
"id": "1CKgJ5HMU_2BJje4hdXZHag",
"text": "PROJ-456: Implement password reset functionality",
"url": "https://jira.example.com/browse/PROJ-456",
"integrationLink": {
"type": "jira",
"integrationId": "1CTPNLhFU_rPbCr23CbqftL",
"issueId": "10456",
"issueTitle": "Implement password reset functionality",
"issueUrl": "https://jira.example.com/browse/PROJ-456",
"remoteLinkId": "12345"
},
"tcaseCount": 3
},
{
"id": "1CKgJ5HMU_3apSDSQWRw6Ys",
"text": "Performance Requirements",
"url": ""
}
]
}
```
## List Requirements (Deprecated)
**Deprecated**
This endpoint is deprecated. Use [List Requirements](#list-requirements) (`GET /api/public/v0/project/{project_id}/requirement/paginated`) instead.
`GET /api/public/v0/project/{project_id}/requirement`
Retrieves all requirements within a project, optionally sorted and with additional fields included.
### Path Parameters
- `project_id`: The project identifier (can be either the project code or UUID)
### Query Parameters
All query parameters are optional.
| Parameter | Type | Description | Allowed Values | Example |
| ----------- | ------ | ---------------------------------------------------------------------- | -------------------- | -------------------- |
| `sortField` | string | Field to sort by | `created_at`, `text` | `sortField=text` |
| `sortOrder` | string | Sort order (requires `sortField`; default: `desc`) | `asc`, `desc` | `sortOrder=asc` |
| `include` | string | Include additional fields in the response which are omitted by default | `tcaseCount` | `include=tcaseCount` |
- Use `include=tcaseCount` to see how many test cases are linked to each requirement
- Sorting by `created_at` shows the most recently created requirements first (with `desc`) or oldest first (with `asc`)
- Sorting by `text` provides alphabetical ordering
### Example Request
#### Fetch all requirements
```bash
curl \
-H "Authorization: ApiKey your.api.key.here" \
https://your-company.your-region-code.qasphere.com/api/public/v0/project/BD/requirement
```
#### Fetch all requirements sorted by text in ascending order
```bash
curl \
-H "Authorization: ApiKey your.api.key.here" \
https://your-company.your-region-code.qasphere.com/api/public/v0/project/BD/requirement?sortField=text&sortOrder=asc
```
#### Fetch all requirements with test case count included
```bash
curl \
-H "Authorization: ApiKey your.api.key.here" \
https://your-company.your-region-code.qasphere.com/api/public/v0/project/BD/requirement?include=tcaseCount
```
### Response Fields
```typescript
{
requirements: Array<{
// List of requirement objects
id: string // Unique identifier of the requirement (HQID7 format)
text: string // Descriptive label for the requirement
url: string // URL to the external requirement document (empty string if not set)
integrationLink?: {
// Integration link (only present if linked to Jira or Linear)
type: string // Integration type ("jira" or "linear")
integrationId: string // ID of the integration configuration
issueId: string // Internal issue ID (Jira numeric ID or Linear UUID)
issueTitle: string // Title of the linked issue
issueUrl: string // Full URL to the linked issue
remoteLinkId: string // Remote link/attachment ID in the external system
}
tcaseCount?: number // Number of test cases linked to this requirement (only included if requested)
}>
}
```
### Example Response
```json
{
"requirements": [
{
"id": "1CKgJ5HMU_1VQTDrRJDdDVW",
"text": "User Authentication",
"url": "https://docs.example.com/specs/auth",
"tcaseCount": 5
},
{
"id": "1CKgJ5HMU_2BJje4hdXZHag",
"text": "PROJ-456: Implement password reset functionality",
"url": "https://jira.example.com/browse/PROJ-456",
"integrationLink": {
"type": "jira",
"integrationId": "1CTPNLhFU_rPbCr23CbqftL",
"issueId": "10456",
"issueTitle": "Implement password reset functionality",
"issueUrl": "https://jira.example.com/browse/PROJ-456",
"remoteLinkId": "12345"
},
"tcaseCount": 3
},
{
"id": "1CKgJ5HMU_3apSDSQWRw6Ys",
"text": "Performance Requirements",
"url": ""
}
]
}
```
---
# Results
URL: /docs/api/result
The results endpoint allows you to add results for test cases in runs. Only users with role test runner or with higher privileges, having access to a project can add results.
Each test case result is assigned a status reflecting the outcome of its execution. QA Sphere supports several common statuses: `passed`, `failed`, `blocked`, `skipped`, and `open`. If you require additional statuses, QA Sphere allows you to create up to four custom statuses. These custom statuses can be used in the results as `custom1`, `custom2`, `custom3`, `custom4`. For more information on viewing and updating custom statuses using public APIs, please refer to the [Settings](https://qasphere.com/docs/api/settings) page.
You can also attach links to external issues created in integrations configured for the project. If the corresponding issue ID/key is provided in the meta information, QA Sphere will add a comment on the issue for non-custom integrations (GitHub, Jira, Linear) to create a bi-directional reference:
- **GitHub/Jira**: Issue number (e.g., `"123"`)
- **Linear**: Issue key (e.g., `"PRJ-123"`)
Public result endpoints support integration links only. They do not accept uploaded file attachments.
## Add Result
`POST /api/public/v0/project/{project_id}/run/{run_id}/tcase/{tcase_or_legacy_id}/result`
Add result for a run test case.
### Path Parameters
- `project_id`: The project identifier (can be either the project code or UUID)
- `run_id`: The run identifier
- `tcase_or_legacy_id`: The test case identifier (can be one of test case UUID, sequence or legacy ID)
### Authentication
Requires an API key with at least Test Runner role permissions. See [Authentication](https://qasphere.com/docs/api/authentication) for more details.
### Request Body
```typescript
{
status: string // Required: Result status ("passed" | "failed" | "blocked" | "skipped" | "open" | "custom1" | "custom2" | "custom3" | "custom4")
comment: html // Required: Comments/observations while executing the test case
timeTaken?: number // Optional: Time taken for executing the test case
links?: Array<{ // Optional: Links to issues on external integration to attach to this result
integrationId: string // Required: Unique identifier of the project integration
url: string // Required: URL of the external issue
text: string // Required: Title of the external issue
meta?: { // Optional: Additional information related to the issue (for non-custom integrations)
id?: string // Optional: Issue ID/key used to add a comment on the external issue linking back to this result
}
}>
}
```
### Response Fields
| Field | Type | Description |
| ----- | -------- | -------------------------------- |
| `id` | `number` | Unique identifier for the result |
### Example Request
```bash
curl \
-H "Authorization: ApiKey your.api.key.here" \
-H "Content-Type: application/json" \
-d '{
"status": "failed",
"comment": "
Login page background color is not correct
",
"links": [{
"integrationId": "1CSWAh3ys_YniqfXepnwT8F",
"url": "https://external-integration/issues/1",
"text": "Login page background color is not correct"
}],
"timeTaken": 60
}' \
https://your-company.your-region-code.qasphere.com/api/public/v0/project/BD/run/1/tcase/1/result
```
### Example Response
```json
{
"id": 10
}
```
### Error Responses
| Status Code | Description |
| ----------- | ------------------------------------------------------------------- |
| 401 | Invalid or missing API key |
| 403 | Insufficient permissions or suspended tenant or project is archived |
| 404 | Project or test run or test case not found |
| 409 | Test run is closed |
| 500 | Internal server error while adding result |
## Add Multiple Results
`POST /api/public/v0/project/{project_id}/run/{run_id}/result/batch`
Add results for multiple test cases in a run.
### Path Parameters
- `project_id`: The project identifier (can be either the project code or UUID)
- `run_id`: The run identifier
### Authentication
Requires an API key with at least Test Runner role permissions. See [Authentication](https://qasphere.com/docs/api/authentication) for more details.
### Request Body
```typescript
{
items: Array<{
// Required: List of result items
tcaseId: string // Required: The unique identifier of the test case
status: string // Required: Result status ("passed" | "failed" | "blocked" | "skipped" | "open" | "custom1" | "custom2" | "custom3" | "custom4")
comment: html // Required: Comments/observations while executing the test case
timeTaken?: number // Optional: Time taken for executing the test case
links?: Array<{
// Optional: Links to issues on external integration to attach to this result
integrationId: string // Required: Unique identifier of the external integration
url: string // Required: URL of the external issue
text: string // Required: Title of the external issue
meta?: {
// Optional: Additional information related to the issue (for non-custom integrations)
id?: string // Optional: Issue ID/key used to add a comment on the external issue linking back to this result
}
}>
}>
}
```
### Response Fields
| Field | Type | Description |
| ----- | ---------- | --------------------------------------------------------------------- |
| `ids` | `number[]` | List of IDs for the created results, in the same order as the request |
### Example Request
```bash
curl \
-H "Authorization: ApiKey your.api.key.here" \
-H "Content-Type: application/json" \
-d '{
"items": [
{
"tcaseId": "1CSm3erpq_Ykq6AVPRrLYd1",
"status": "failed",
"comment": "
",
"links": [{
"integrationId": "1CSWAh3ys_YniqfXepnwT8F",
"url": "https://external-integration/issues/1",
"text": "Page failed to load"
}]
}
]
}' \
https://your-company.your-region-code.qasphere.com/api/public/v0/project/BD/run/1/result/batch
```
### Example Response
```json
{
"ids": [11, 12, 13]
}
```
### Error Responses
| Status Code | Description |
| ----------- | ------------------------------------------------------------------- |
| 401 | Invalid or missing API key |
| 403 | Insufficient permissions or suspended tenant or project is archived |
| 404 | Project or test run not found |
| 409 | Test run is closed |
| 500 | Internal server error while adding result |
**Validation**
The system validates that the run belongs to the project, test case belongs to the run, the project is not archived and the run is not closed. Attempting to add result which does not satisfy these validations will result in an error.
---
# Runs
URL: /docs/api/run
The runs endpoints allow you to create and manage test executions in your project. You can create new runs, list existing runs, manage test cases within runs, and track their results. Write operations (create/update/delete) can only be performed by users with role test runner or with higher privileges.
## Types of Runs
QA Sphere supports three types of test runs:
### 1. User Selection (Static Structure)
- Specified by `type: "static_struct"`
- Test cases can be selected by their IDs or using filters (folders, tags, priorities)
- Test cases in the run are fixed after creation unless manually updated
- Updates to versioned test case properties, such as title and steps, are reflected for test cases with open statuses
### 2. Static Runs
- Specified by `type: "static"`
- Test cases can be selected directly by IDs or using filters (folders, tags, priorities)
- Similar to Static Structure in that test cases are fixed after creation
- Updates to versioned test case properties, such as title and steps, are not reflected in the run, even for test cases with open statuses
### 3. Live Runs
- Specified by `type: "live"`
- Only dynamic selection based on folder, tag, and priority filters
- Test cases are automatically added/removed when they match or do not match filter criteria
- Supports multiple query plans for flexible test case selection
- Updates to versioned test case properties, such as title and steps, are reflected for test cases with open statuses
1. Updates to test cases are never propagated to closed runs
2. For live and user selection runs, test case versions are fixed once the status is non-open. As a result, updates to versioned test case properties, such as title and steps, are not reflected in the run
3. Changes to the folder and position of test cases are always propagated to all run types, except closed runs, because these changes are not versioned. This means that such updates do not create a new test case version and are applied to all existing versions of the test case
## Test Case Selection
Test cases can be selected in two ways:
1. **Direct Selection**: Use `tcaseIds` to directly specify the test cases
2. **Using filters**:
- `folderIds`: Select test cases from specific folders, including those within subfolders
- `tagIds`: Select test cases with specific tags
- `priorities`: Select test cases with specific priority levels
- If any of these filters is not specified or is left empty, all test cases are selected without filtering based on that criterion
- The resulting list of test cases is obtained by applying a logical AND to these conditions
This selection method is referred to as a **Query Plan**.
- For static and user selection runs, only single query plan can be specified. When using filters, the system automatically resolves them to a fixed set of test cases at the time of creation
- For live runs, only filter-based selection is allowed, and multiple query plans can be specified. The results of all query plans are combined using a union to create the final list of test cases. Additionally, as test case properties change, test cases are automatically added to or removed from the run according to the query plans
1. Only `standalone` and `filled` test case types are allowed in a run.
## List Runs
`GET /api/public/v0/project/{project_id}/run/paginated`
`/paginated` endpoints are transitional. In API v1, the base paths will return paginated responses and the `/paginated` suffix will be removed.
Returns all runs in a project with their current status.
### Query Parameters
| Parameter | Type | Description | Default | Example |
| ------------------ | ------ | ---------------------------------------------------------------------------------------------------------------------------------------------------------------------------- | ------------ | -------------------------------------------- |
| `closed` | bool | Filter by run status. | No filter | `closed=true` |
| `milestoneIds` | number | Filter by milestone ID. Repeat the parameter for multiple IDs. | No filter | `milestoneIds=1&milestoneIds=2` |
| `planIds` | number | Filter by plan ID. Repeat the parameter for multiple IDs. | No filter | `planIds=3` |
| `configurationIds` | string | Filter by configuration ID. Repeat the parameter for multiple IDs. | No filter | `configurationIds=abc123` |
| `offset` | number | Number of rows to skip before returning results. | `0` | `offset=10` |
| `limit` | number | Maximum number of rows to return. Accepted range: 0–1,000. | `100` | `limit=20` |
| `sortField` | string | Field to sort by: `title`, `created_at`, `last_activity_at`, or `closed_at`. | `created_at` | `sortField=created_at` |
| `sortOrder` | string | Sort direction for `sortField`: `asc` or `desc`. | `desc` | `sortOrder=desc` |
| `include` | string | Include additional fields omitted by default. Accepted values: `project`, `plan`, `milestone`, `assignment`, `configuration`, or `statusCounts`. Repeat for multiple values. | None | `include=configuration&include=statusCounts` |
### Example Request
```bash
curl \
-H "Authorization: ApiKey your.api.key.here" \
https://your-company.your-region-code.qasphere.com/api/public/v0/project/BD/run/paginated
```
### Response Fields
```typescript
{
total: number, // Total number of runs
offset: number, // The page offset
limit: number, // The page limit
data: Array<{ // List of runs in the page
id: number // Unique identifier of the test run
type: string // Type of the run (`static` | `static_struct` | `live`)
title: string // Title of the test run
description: html // Description of the test run
projectId: string // ID of the project this run belongs to
project: { // Project details when include=project is passed
id: string // Project unique identifier
code: string // Project code
title: string // Project title
} | null
planId: number | null // ID of the test plan to which the run belongs to (if any)
plan: { // Test plan details when include=plan is passed (if any)
title: string // Test plan title
} | null
milestoneId: number | null // ID of associated milestone (if any)
milestone: { // Milestone details when include=milestone is passed (if any)
title: string // Milestone Title
} | null
assignmentId: number | null // ID of the assigned user (if any)
assignment: { // Assignee details when include=assignment is passed (if any)
id: number // User ID
email: string // User email
name: string // User display name
avatar: string // URL to user's avatar; fetching it requires authentication
role: string // User role in the project
} | null
configurationId: string | null // ID of the configuration associated with the run (if any)
configuration: { // Configuration details when include=configuration is passed (if any)
id: string // Configuration ID
title: string // Configuration title
createdAt: string // Configuration creation timestamp
updatedAt: string // Configuration last update timestamp
} | null
statusCounts: { // Count of run test cases by status when include=statusCounts is passed
all: number // Total test cases
blocked: number // Blocked test cases
failed: number // Failed test cases
open: number // Open test cases
passed: number // Passed test cases
skipped: number // Skipped test cases
custom1: number // Count of test cases with first custom status
custom2: number // Count of test cases with second custom status
custom3: number // Count of test cases with third custom status
custom4: number // Count of test cases with fourth custom status
} | null
timeSpent: number | null // Time spent on the run
isAutomated: boolean // Whether the run was created using public APIs
createdAt: string // Run creation timestamp
closedAt: string | null // Run closure timestamp
closedByUserId: number | null // ID of user who closed the run
}>
}
```
## List Runs (Deprecated)
**Deprecated**
This endpoint is deprecated. Use [List Runs](#list-runs) (`GET /api/public/v0/project/{project_id}/run/paginated`) instead.
`GET /api/public/v0/project/{project_id}/run`
Returns all runs in a project with their current status.
### Query Parameters
| Parameter | Description | Example |
| -------------- | ------------------------------------------------------------------------- | -------------------------------------------- |
| `closed` | Filter by run status | `closed=true` or `closed=false` |
| `milestoneIds` | Filter by milestone | `milestoneIds=1&milestoneIds=2` |
| `limit` | Maximum number of runs to return | `limit=10` |
| `include` | Return only the specified related objects (all are returned when omitted) | `include=configuration&include=statusCounts` |
By default every related object listed under [Response Fields](#response-fields) is returned. Supply one or more `include` values to return **only** the related objects you need — any related object you do not list is returned as `null`. Allowed values: `project`, `plan`, `milestone`, `assignment`, `configuration`, `statusCounts`.
### Example Request
```bash
curl \
-H "Authorization: ApiKey your.api.key.here" \
https://your-company.your-region-code.qasphere.com/api/public/v0/project/BD/run
```
### Response Fields
```typescript
{
runs: Array<{
id: number // Unique identifier of the test run
type: string // Type of the run (`static` | `static_struct` | `live`)
title: string // Title of the test run
description: html // Description of the test run
projectId: string // ID of the project this run belongs to
project: {
// Project details
id: string // Project unique identifier
code: string // Project code
title: string // Project title
}
planId: number | null // ID of the test plan to which the run belongs to (if any)
plan: {
// Test plan details (if any)
title: string // Test plan title
} | null
milestoneId: number | null // ID of associated milestone (if any)
milestone: {
// Milestone details (if any)
title: string // Milestone Title
} | null
assignmentId: number | null // ID of the assigned user (if any)
assignment: {
// Assignee details (if any)
id: number // User ID
email: string // User email
name: string // User display name
avatar: string // URL to user's avatar; fetching it requires authentication
role: string // User role in the project
} | null
configurationId: number | null // ID of the configuration associated with the run (if any)
configuration: {
// Configuration details (if any)
id: string // Configuration ID
title: string // Configuration title
createdAt: string // Configuration creation timestamp
updatedAt: string // Configuration last update timestamp
} | null
statusCounts: {
// Count of run test cases by status
all: number // Total test cases
blocked: number // Blocked test cases
failed: number // Failed test cases
open: number // Open test cases
passed: number // Passed test cases
skipped: number // Skipped test cases
custom1: number // Count of test cases with first custom status
custom2: number // Count of test cases with second custom status
custom3: number // Count of test cases with third custom status
custom4: number // Count of test cases with fourth custom status
}
timeSpent: number | null // Time spent on the run
isAutomated: boolean // Whether the run was created using public APIs
createdAt: string // Run creation timestamp
closedAt: string | null // Run closure timestamp
closedByUserId: number | null // ID of user who closed the run
}>
}
```
## Create New Run
`POST /api/public/v0/project/{project_id}/run`
Creates a new test run in the project.
1. For `static`/`static_struct` run types:
- Only a single query plan should be specified, and either of the two selection methods (direct or filters) can be used
- When using filters, the system automatically resolves them to a fixed set of test cases at the time of creation
2. For `live` run types, only filter-based selection is permitted, and multiple query plans can be specified
3. Within a given query plan, the filter conditions are combined using a logical AND
4. The test case lists obtained from different query plans are combined using a union
5. Only `standalone` and `filled` test case types are allowed in a run
### Authentication
Requires an API key with at least Test Runner role permissions. See [Authentication](https://qasphere.com/docs/api/authentication) for more details.
### Request Body
```typescript
{
title: string // Required: Run title
description?: html // Optional: Run description
type: string // Required: Run type (`static` | `static_struct` | `live`)
milestoneId?: number // Optional: Associated milestone
configurationId?: string // Optional: Associated configuration
assignmentId?: number // Optional: Assigned user
queryPlans: Array<{ // Required: Test case selection criteria
// Direct Selection:
tcaseIds?: Array // Directly specify test cases
// Using Filters:
folderIds?: Array // Select test cases from folders (including subfolders)
tagIds?: Array // Select test cases with tags
priorities?: Array // Select by priority (`low` | `medium` | `high`)
}>
}
```
**Field Constraints**
- `title`: Must be 1-255 characters long and unique within the project
- `description`: Maximum 512 characters
- `queryPlans`:
- For non-live runs: Only one query plan is allowed
- For live runs: Only filter based selection is allowed
- `milestoneId`: The milestone must belong to the project and must not be archived
- `assignmentId`: Must be an active user with permissions above Viewer role
### Example Request - Live Run With Filtered Test Cases
```bash
curl \
-H "Authorization: ApiKey your.api.key.here" \
-H "Content-Type: application/json" \
-d '{
"title": "Sprint 23 Regression",
"description": "
Regression test suite for Sprint 23 release
",
"type": "live",
"milestoneId": 5,
"queryPlans": [{
"folderIds": [1, 2],
"tagIds": [1],
"priorities": ["high"]
}, {
"folderIds": [4, 6],
"tagIds": [],
"priorities": ["medium", "high"]
}]
}' \
https://your-company.your-region-code.qasphere.com/api/public/v0/project/BD/run
```
### Example Request - Live Run With All Test Cases
```bash
curl \
-H "Authorization: ApiKey your.api.key.here" \
-H "Content-Type: application/json" \
-d '{
"title": "Complete Test Suite",
"description": "
Run with all test cases from the project
",
"type": "live",
"milestoneId": 5,
"queryPlans": [{
"folderIds": [],
"tagIds": [],
"priorities": []
}]
}' \
https://your-company.your-region-code.qasphere.com/api/public/v0/project/BD/run
```
### Example Request - Static Run With Specific Test Cases
```bash
curl \
-H "Authorization: ApiKey your.api.key.here" \
-H "Content-Type: application/json" \
-d '{
"title": "Specific Test Cases Run",
"type": "static",
"queryPlans": [{
"tcaseIds": ["1CEPaUhgH_Tvt2LZygwVRQa", "1CAPaUhgH_Tvt2LZygwVRTb", "1EEPaUhgH_Tvt2LZygwVRLm"]
}]
}' \
https://your-company.your-region-code.qasphere.com/api/public/v0/project/BD/run
```
### Response
Status: 201 Created
```json
{
"id": 2
}
```
**Best Practices**
- Use live runs for ongoing test suites that should automatically update
- Use static runs for fixed test sets like release certifications
- Always provide descriptive titles and link runs to milestones when applicable
- Assign runs to specific users for better accountability
## Clone Existing Run
`POST /api/public/v0/project/{project_id}/run/clone`
Creates a new run by cloning an existing one. For live runs, the new run will reflect current test case states.
The support for cloning runs with test plans via this endpoint is planned for a future release.
### Authentication
Requires an API key with at least Test Runner role permissions. See [Authentication](https://qasphere.com/docs/api/authentication) for more details.
### Request Body
```typescript
{
runId: number // Required: Source run ID to clone
title: string // Required: New run title
description?: html // Optional: New description
milestoneId?: number // Optional: New milestone
assignmentId?: number // Optional: New assignee
}
```
**Field Constraints**
- `title`: Must be 1-255 characters long and unique within the project
- `description`: Maximum 512 characters
- `runId`: Must be a valid run ID in the project
- `milestoneId`: The milestone must belong to the project and must not be archived
- `assignmentId`: Must be an active user with permissions above Viewer role
### Example Request
```bash
curl \
-H "Authorization: ApiKey your.api.key.here" \
-H "Content-Type: application/json" \
-d '{
"runId": 1,
"title": "Sprint 24 Regression - Clone",
"description": "
Cloned regression suite for Sprint 24
",
"milestoneId": 5,
"assignmentId": 1
}' \
https://your-company.your-region-code.qasphere.com/api/public/v0/project/BD/run/clone
```
### Example Response
```json
{
"id": 2
}
```
When cloning a live run, the new run will:
- Maintain the same query plans as the original run
- Reflect the current state of test cases (may differ from the original run)
- Start with all test cases in 'open' status regardless of the original run's results
## Close Run
`POST /api/public/v0/project/{project_id}/run/{run_id}/close`
Close an open test run.
### Authentication
Requires an API key with at least Test Runner role permissions. See [Authentication](https://qasphere.com/docs/api/authentication) for more details.
### Example Request
```bash
curl \
-H "Authorization: ApiKey your.api.key.here" \
-H "Content-Type: application/json" \
https://your-company.your-region-code.qasphere.com/api/public/v0/project/BD/run/1/close
```
## List Run Test Cases
`GET /api/public/v0/project/{project_id}/run/{run_id}/tcase/paginated`
`/paginated` endpoints are transitional. In API v1, the base paths will return paginated responses and the `/paginated` suffix will be removed.
Returns all test cases in a run with their current status.
### Query Parameters
Some query parameters can be specified multiple times using the format `param=value1¶m=value2¶m=value3`.
| Parameter | Type | Description | Default | Example |
| -------------------------------- | ------ | -------------------------------------------------------------------------------------------------------------------------------------------- | ----------------------- | ------------------------- |
| `search` | string | Filter test cases by title using case-insensitive partial matching. | No filter | `search=ui` |
| `tags` | number | Filter by tag ID. Repeat the parameter for multiple IDs; multiple values use OR logic. | No filter | `tags=12` |
| `priorities` | string | Filter by priority: `high`, `medium`, or `low`. Repeat the parameter for multiple values; multiple values use OR logic. | No filter | `priorities=low` |
| `cf_${custom field system name}` | string | Filter by a value defined for the custom field. Repeat the parameter for multiple values; multiple values use OR logic. | No filter | `cf_automation=Automated` |
| `offset` | number | Number of rows to skip before returning results. | `0` | `offset=10` |
| `limit` | number | Maximum number of rows to return. Accepted range: 0–1,000. | `100` | `limit=20` |
| `sortField` | string | Field to sort by: `seq`, `folder_id`, `pos`, `title`, `priority`, or `status`. | `folder_id`, then `pos` | `sortField=title` |
| `sortOrder` | string | Sort direction for `sortField`: `asc` or `desc`. | `asc` | `sortOrder=asc` |
| `include` | string | Include fields omitted by default: `folder`, `steps`, `tags`, `precondition`, `requirements`, or `customFields`. Repeat for multiple values. | None | `include=steps` |
- Different filters are combined with AND logic
- Multiple values for the same filter are combined with OR logic
- `include=steps`, `include=tags`, `include=precondition`, `include=requirements` and
`include=customFields` return the content of the exact test case version pinned by the
run, so the response matches what the run's results were recorded against even if a
test case was edited later. The
[Test Cases list endpoint](/docs/api/endpoints/tcases) always returns the latest version instead.
### Example Request
#### Fetch all run test cases with additional folder information
```bash
curl \
-H "Authorization: ApiKey your.api.key.here" \
https://your-company.your-region-code.qasphere.com/api/public/v0/project/BD/run/1/tcase/paginated?include=folder
```
#### Fetch all run test cases with their steps and tags in a single request
```bash
curl \
-H "Authorization: ApiKey your.api.key.here" \
"https://your-company.your-region-code.qasphere.com/api/public/v0/project/BD/run/1/tcase/paginated?include=steps&include=tags"
```
#### Fetch all test cases from a run with "Automation" custom field to be "Automated"
```bash
curl \
-H "Authorization: ApiKey your.api.key.here" \
https://your-company.your-region-code.qasphere.com/api/public/v0/project/BD/run/1/tcase/paginated?cf_automation=Automated
```
#### Fetch 20 test cases from a run sorted by title in ascending order
```bash
curl \
-H "Authorization: ApiKey your.api.key.here" \
https://your-company.your-region-code.qasphere.com/api/public/v0/project/BD/run/1/tcase/paginated?limit=20&sortField=title&sortOrder=asc
```
#### Fetch 10 test cases ordered by sequence number
```bash
curl \
-H "Authorization: ApiKey your.api.key.here" \
https://your-company.your-region-code.qasphere.com/api/public/v0/project/BD/run/1/tcase/paginated?limit=10&sortField=seq&sortOrder=asc
```
#### Fetch test cases with "backend" in their title from a run
```bash
curl \
-H "Authorization: ApiKey your.api.key.here" \
https://your-company.your-region-code.qasphere.com/api/public/v0/project/BD/run/1/tcase/paginated?search=backend
```
#### Fetch test cases with tag ID 12 from a run
```bash
curl \
-H "Authorization: ApiKey your.api.key.here" \
https://your-company.your-region-code.qasphere.com/api/public/v0/project/BD/run/1/tcase/paginated?tags=12
```
#### Fetch test cases with priority "high" from a run
```bash
curl \
-H "Authorization: ApiKey your.api.key.here" \
https://your-company.your-region-code.qasphere.com/api/public/v0/project/BD/run/1/tcase/paginated?priorities=high
```
### Response Fields
```typescript
{
total: number, // Total number of run test cases
offset: number, // The page offset
limit: number, // The page limit
data: Array<{ // List of run test cases in the page
id: string // Unique identifier of the test case
version: number // Version number of the test case
legacyId: string // Legacy identifier (if any)
type: string. // Type of the test case (`standalone` | `filled`)
folderId: number // ID of the folder containing the test case
pos: number // Position within the folder
seq: number // Sequence number
title: string // Title/description of the test case
priority: string // Priority level (high, medium, etc.)
status: string // Status of the latest result added for the run test case (open if no results are added)
isAutomated: boolean // Whether latest result was added using public APIs
isEmpty: boolean // Whether the test case is empty (has no comment and steps)
templateTCaseId?: string // Corresponding template test case ID, if it is a filled test case
folder?: { // Folder information if include=folder query parameter is passed
id: number // Unique identifier for the folder
parentId: number // Unique identifier of the parent of the folder (0 if it is the root folder)
title: string // Title of the folder
comment: html // Added comment for the folder
pos: number // Position of the folder with respect to its sibling (starts with 0)
}
steps?: Array // Steps of the pinned test case version if include=steps is passed (same shape as `steps` in the Get Run Test Case response below)
tags?: Array<{ // Tags of the pinned test case version if include=tags is passed
id: number // Unique identifier of the tag
title: string // Title of the tag
}>
precondition?: { // Precondition of the pinned test case version if include=precondition is passed
projectId: string // Project id the precondition belongs to
id: number // Unique identifier of the precondition
version: number // Version of the precondition
type: string // Type of the precondition (standalone | shared)
title?: string // Title of the precondition (only for shared preconditions)
text: html // Text of the precondition (empty when the test case has none)
isLatest: boolean // Whether this is the latest version of the precondition
}
requirements?: Array<{ // Requirements of the pinned test case version if include=requirements is passed
id: string // Unique identifier of the requirement
text: string // Title of the requirement
url: string // URL of the requirement
}>
customFields?: { // Custom fields of the pinned test case version if include=customFields is passed
[key: string]: { // Key-value pairs of custom field system names and corresponding details
value: string. // Current value
isDefault: boolean // Whether default value is set by the system or selected by the user
}
}
}>
}
```
### Sample Response
```
{
"total": 2,
"offset": 0,
"limit": 100,
"data": [
{
"id": "1CGeNaNVt_Axa7TcMjUm6Zh",
"version": 1,
"legacyId": "",
"type": "standalone",
"folderId": 11848,
"pos": 3,
"seq": 8,
"title": "The \"Checkout\" page with products from the cart should be shown after clicking the \"Checkout\" button",
"priority": "high",
"status": "open",
"isAutomated": false,
"isEmpty": true
},
{
"id": "1CGeNaNWP_Eiq5mjzPsKSX9",
"version": 1,
"legacyId": "",
"type": "filled",
"folderId": 11848,
"pos": 4,
"seq": 9,
"title": "The cart is still filled after going back from the \"Checkout\" page without submitting it",
"priority": "medium",
"status": "open",
"isAutomated": false,
"isEmpty": false
}
]
}
```
## List Run Test Cases (Deprecated)
**Deprecated**
This endpoint is deprecated. Use [List Run Test Cases](#list-run-test-cases) (`GET /api/public/v0/project/{project_id}/run/{run_id}/tcase/paginated`) instead.
`GET /api/public/v0/project/{project_id}/run/{run_id}/tcase`
Returns all test cases in a run with their current status.
### Query Parameters
All query parameters are optional and some can be specified multiple times using the format `param=value1¶m=value2¶m=value3`.
| Parameter | Type | Multiple | Description | Allowed Values | Example |
| -------------------------------- | ------ | -------- | ---------------------------------------------------------------------- | ------------------------------------------------------------------------- | ------------------------- |
| `search` | string | no | Filter test cases by title (case insensitive, partial matches) | | `search=ui` |
| `tags` | number | yes | Filter test cases by tag ID | | `tags=12` |
| `priorities` | string | yes | Filter test cases by priority | `high`, `medium`, `low` | `priorities=low` |
| `include` | string | yes | Include additional fields in the response which are omitted by default | `folder`, `steps`, `tags`, `precondition`, `requirements`, `customFields` | `include=steps` |
| `cf_${custom field system name}` | string | yes | Filter test cases by custom field value | Custom field defined values | `cf_automation=Automated` |
- Different filters are combined with AND logic
- Multiple values for the same filter are combined with OR logic
- `include=steps`, `include=tags`, `include=precondition`, `include=requirements` and
`include=customFields` return the content of the exact test case version pinned by the
run, so the response matches what the run's results were recorded against even if a
test case was edited later. The
[Test Cases list endpoint](/docs/api/endpoints/tcases) always returns the latest version instead.
### Example Request
#### Fetch all run test cases with additional folder information
```bash
curl \
-H "Authorization: ApiKey your.api.key.here" \
https://your-company.your-region-code.qasphere.com/api/public/v0/project/BD/run/1/tcase?include=folder
```
#### Fetch all run test cases with their steps and tags in a single request
```bash
curl \
-H "Authorization: ApiKey your.api.key.here" \
"https://your-company.your-region-code.qasphere.com/api/public/v0/project/BD/run/1/tcase?include=steps&include=tags"
```
#### Fetch all test cases from a run with "Automation" custom field to be "Automated"
```bash
curl \
-H "Authorization: ApiKey your.api.key.here" \
https://your-company.your-region-code.qasphere.com/api/public/v0/project/BD/run/1/tcase?cf_automation=Automated
```
#### Fetch 20 test cases from a run sorted by title in ascending order
```bash
curl \
-H "Authorization: ApiKey your.api.key.here" \
https://your-company.your-region-code.qasphere.com/api/public/v0/project/BD/run/1/tcase?limit=20&sortField=title&sortOrder=asc
```
#### Fetch 10 most recent added test cases from a run
```bash
curl \
-H "Authorization: ApiKey your.api.key.here" \
https://your-company.your-region-code.qasphere.com/api/public/v0/project/BD/run/1/tcase?limit=10&sortField=created_at&sortOrder=desc
```
#### Fetch test cases with "backend" in their title from a run
```bash
curl \
-H "Authorization: ApiKey your.api.key.here" \
https://your-company.your-region-code.qasphere.com/api/public/v0/project/BD/run/1/tcase?search=backend
```
#### Fetch test cases with tag "cart" from a run
```bash
curl \
-H "Authorization: ApiKey your.api.key.here" \
https://your-company.your-region-code.qasphere.com/api/public/v0/project/BD/run/1/tcase?tag=cart
```
#### Fetch test cases with priority "high" from a run
```bash
curl \
-H "Authorization: ApiKey your.api.key.here" \
https://your-company.your-region-code.qasphere.com/api/public/v0/project/BD/run/1/tcase?priority=high
```
### Response Fields
```typescript
{
tcases: Array<{
id: string // Unique identifier of the test case
version: number // Version number of the test case
legacyId: string // Legacy identifier (if any)
type: string // Type of the test case (`standalone` | `filled`)
folderId: number // ID of the folder containing the test case
pos: number // Position within the folder
seq: number // Sequence number
title: string // Title/description of the test case
priority: string // Priority level (high, medium, etc.)
status: string // Status of the latest result added for the run test case (open if no results are added)
isAutomated: boolean // Whether latest result was added using public APIs
isEmpty: boolean // Whether the test case is empty (has no comment and steps)
templateTCaseId?: string // Corresponding template test case ID, if it is a filled test case
folder?: {
// Folder information if include=folder query parameter is passed
id: number // Unique identifier for the folder
parentId: number // Unique identifier of the parent of the folder (0 if it is the root folder)
title: string // Title of the folder
comment: html // Added comment for the folder
pos: number // Position of the folder with respect to its sibling (starts with 0)
}
steps?: Array // Steps of the pinned test case version if include=steps is passed
// (same shape as `steps` in the Get Run Test Case response below)
tags?: Array<{
// Tags of the pinned test case version if include=tags is passed
id: number // Unique identifier of the tag
title: string // Title of the tag
}>
precondition?: {
// Precondition of the pinned test case version if include=precondition is passed
projectId: string // Project id the precondition belongs to
id: number // Unique identifier of the precondition
version: number // Version of the precondition
type: string // Type of the precondition (standalone | shared)
title?: string // Title of the precondition (only for shared preconditions)
text: html // Text of the precondition (empty when the test case has none)
isLatest: boolean // Whether this is the latest version of the precondition
}
requirements?: Array<{
// Requirements of the pinned test case version if include=requirements is passed
id: string // Unique identifier of the requirement
text: string // Title of the requirement
url: string // URL of the requirement
}>
customFields?: {
// Custom fields of the pinned test case version if include=customFields is passed
[key: string]: {
// Key-value pairs of custom field system names and corresponding details
value: string // Current value
isDefault: boolean // Whether default value is set by the system or selected by the user
}
}
}>
}
```
### Sample Response
```
{
"tcases": [
{
"id": "1CGeNaNVt_Axa7TcMjUm6Zh",
"version": 1,
"legacyId": "",
"type": "standalone",
"folderId": 11848,
"pos": 3,
"seq": 8,
"title": "The \"Checkout\" page with products from the cart should be shown after clicking the \"Checkout\" button",
"priority": "high",
"status": "open",
"isAutomated": false,
"isEmpty": true
},
{
"id": "1CGeNaNWP_Eiq5mjzPsKSX9",
"version": 1,
"legacyId": "",
"type": "filled",
"folderId": 11848,
"pos": 4,
"seq": 9,
"title": "The cart is still filled after going back from the \"Checkout\" page without submitting it",
"priority": "medium",
"status": "open",
"isAutomated": false,
"isEmpty": false
}
]
}
```
## Get Run Test Case
`GET /api/public/v0/project/{project_id}/run/{run_id}/tcase/{tcase_or_legacy_id}`
Get details of a single run test case using its ID, sequence or legacy ID.
Step `data` items follow the shape described in the Step Test Data section of the [Test Cases](/docs/api/tcases/#step-test-data) page.
### Example Request
```bash
curl \
-H "Authorization: ApiKey your.api.key.here" \
https://your-company.your-region-code.qasphere.com/api/public/v0/project/BD/run/1/tcase/1
```
### Response Fields
```typescript
{
id: string // Unique identifier of the test case
version: number // Version number of the test case
legacyId: string // Legacy identifier (if any)
type: string // Test case type (`standalone` | `filled`)
title: string // Title of the test case
seq: number // Sequence number of the test case
folderId: number // Identifier of the folder where the test case is placed
pos: number // Ordered position (0 based) of the test case in its folder
priority: string // Priority of the test case (`high` | `medium` | `low`)
templateTCaseId: string | null // Identifier of the parent template test case (in case of `filled` test case type)
comment: html // Test case precondition
steps: Array<{ // List of test case steps
id: number // Unique identifier of the step
type: string // Type of the step (standalone | shared)
version: number // Version of the step (always 1 for standalone steps)
isLatest: boolean // Whether this is the latest version of the step (always true for standalone steps)
title?: string // Title of the step (only for shared steps)
subSteps?: Array<{ // List of sub steps (only for shared steps)
id: number // Unique identifier of the step
type: string // Type of the step (shared_sub_step)
version: number // Version of the step (same as parent step)
isLatest: boolean // Whether this is the latest version (same as parent step)
description: html // Details of the sub step
expected: html // Expected result from the sub step
data?: Array // Sub step test data items (see Step Test Data on the Test Cases page)
deletedAt?: string // Date the sub step was deleted on
}>
description?: html // Details of step (only for standalone steps)
expected?: html // Expected result from the step (only for standalone steps)
data?: Array // Step test data items, only for standalone steps (see Step Test Data)
deletedAt?: string // Date the step was deleted on
}>
tags: Array<{ // List of test case tags
id: number // Unique identifier of the tag
title: string // Title of the tag
}>
files: Array<{ // List of files attached to the test case
id: string // Unique identifier of the file
fileName: string // Name of the file
mimeType: string // Mime type of the file
size: number // Size of the file
url: string // URL of the file
}>
requirements: Array<{ // Test case requirement (currently only single requirement is supported on UI)
id: string // Unique identifier of the requirement
text: string // Title of the requirement
url: string // URL of the requirement
}>
links: Array<{ // Additional links relevant to the test case
text: string // Title of the link
url: string // URL of the link
}>
customFields: { // Custom fields defined for the test case
[key: string]: { // Key-value pairs of custom field system names and corresponding details for the test case
value: string // Current value
isDefault: boolean // Whether default value is set by the system or selected by the user
}
}
authorId: number // Unique identifier of the user who created the test case
createdAt: string // Test case creation timestamp (ISO 8601 format)
status: string // Status of the latest result added for the run test case (open if no results are added)
isAutomated: boolean // Whether latest result was added using public APIs
isLatestVersion: boolean // Whether this is the latest version of the test case
isEmpty: boolean // Whether the test case is empty (has no comment and steps)
templateTCaseId?: string // Corresponding template test case ID, if it is a filled test case
results: Array<{ // Results created for this test case in the run
id: number // Unique identifier of the test case result
tcaseId: string // Unique identifier of the test case
tcaseVersion: string // Version number of the test case
authorId: number // Unique identifier of the user who added the result
author: { // Details of the user who added the result
id: number // Unique identifier of the user
email: string // Email of the user
name: string // Name of the user
avatar: string | null // Avatar URL of the user; fetching it requires authentication
role: string // Role of the user (`owner` | `admin` | `user` | `test-runner` | `viewer`)
}
status: string // Result status (`passed` | `failed` | `blocked` | `skipped` | `open` | `custom1` | `custom2` | `custom3` | `custom4`)
comment: html // Comments/observations while executing the test case
links: Array<{ // Details of issues created in external integrations
id: number // Unique identifier of the issue
resultId: number // Unique identifier of the result for which the issue is created
integrationId: string // Unique identifier of the external integration on which the issue is created
integration: { // Details of the external integration
id: string // Unique identifier of the integration
name: string // Name of the integration
type: string // Integration type (`jira` | `github` | `custom`)
config: object // Configuration for the integration (eg. url/email)
}
url: string // URL of the created issue
text: string // Title of the created issue
meta: object // Additional information related to the issue
}>
timeTaken: number | null // Time taken for executing the test case
apiKeyId: string | null // Unique identifier of the API key, if this result was added via public APIs
internal: boolean // Whether the result was added by system (eg. when test run is modified)
createdAt: string // Result creation time (ISO 8601 format)
}>
}
```
### Sample Response
```json
{
"id": "1CEPaUhgH_Tvt2LZygwVRQa",
"version": 1,
"legacyId": "",
"type": "standalone",
"title": "Changing to corresponding cursor after hovering the element",
"seq": 1,
"folderId": 2,
"pos": 0,
"priority": "low",
"templateTCaseId": null,
"comment": "
The \"About Us\" page is opened
",
"steps": [
{
"description": "
Test the display across various screen sizes (desktop, tablet, mobile) to ensure that blocks and buttons adjust appropriately to different viewport widths
",
"expected": ""
}
],
"tags": [
{
"id": 1,
"title": "About Us"
},
{
"id": 2,
"title": "Checklist"
}
],
"files": [],
"requirements": [],
"links": [],
"customFields": {},
"authorId": 1,
"createdAt": "2024-01-01T00:00:00.000Z",
"status": "open",
"isAutomated": false,
"isLatestVersion": true,
"isEmpty": false,
"results": [
{
"id": 20293,
"tcaseId": "1CEPaUhgH_Tvt2LZygwVRQa",
"tcaseVersion": 1,
"authorId": 1,
"author": {
"id": 1,
"email": "owner@example.com",
"name": "System Owner",
"avatar": null,
"role": "owner"
},
"status": "blocked",
"comment": "",
"links": null,
"timeTaken": null,
"apiKeyId": null,
"internal": false,
"createdAt": "2024-01-01T00:00:00.000Z"
}
]
}
```
## Create Run Log
`POST /api/public/v0/project/{project_id}/run/{run_id}/log`
Create a log entry for a test run. Run logs can be used to record messages from CI/CD pipelines, automation frameworks, or any external system during test execution. Logs cannot be added to closed runs.
### Path Parameters
- `project_id`: The project identifier (can be either the project code or UUID)
- `run_id`: The run identifier (numeric)
### Authentication
Requires an API key with at least Test Runner role permissions. See [Authentication](https://qasphere.com/docs/api/authentication) for more details.
### Request Body
```typescript
{
comment: string // Required: Log message content (HTML supported, minimum 1 character)
}
```
**Field Constraints**
- `comment`: Must be at least 1 character long. HTML content is sanitized and leading/trailing whitespace is trimmed.
### Example Request
```bash
curl \
-H "Authorization: ApiKey your.api.key.here" \
-H "Content-Type: application/json" \
-d '{
"comment": "
Build #1234 failed: 3 test cases did not pass
"
}' \
https://your-company.your-region-code.qasphere.com/api/public/v0/project/BD/run/1/log
```
### Response Fields
| Field | Type | Description |
| ----- | -------- | --------------------------------- |
| `id` | `string` | Unique identifier for the run log |
### Example Response
Status: 201 Created
```json
{
"id": "1CGeNaNVt_Axa7TcMjUm6Zh"
}
```
### Error Responses
| Status Code | Description |
| ----------- | ------------------------------------------------------------------- |
| 400 | Invalid request body or empty comment |
| 401 | Invalid or missing API key |
| 403 | Insufficient permissions or suspended tenant or project is archived |
| 404 | Project or test run not found |
| 409 | Test run is closed |
| 500 | Internal server error while creating log |
---
# Settings
URL: /docs/api/settings
The settings endpoint allows you to check and update result statuses.
## Result Status
Each test case result is assigned a status based on the outcome of its execution. QA Sphere supports two categories of statuses:
1. **Default Statuses**: These are the commonly used statuses that come by default. They include `passed`, `failed`, `blocked`, `skipped`, and `open`. These statuses cannot be removed or modified.
2. **Custom Statuses**: If additional statuses are needed, QA Sphere allows for the creation of up to four custom statuses. The labels and colors for these custom statuses can be configured and will be displayed in the UI. In the API, these statuses are referred to as `custom1`, `custom2`, `custom3`, and `custom4`.
## Get Statuses
`GET /api/public/v0/settings/preferences/status`
Get current status configuration.
### Response
Status: 200 OK
```typescript
{
statuses: Array<{
id: string // Unique identifier for the status ("passed" | "failed" | "blocked" | "skipped" | "open" | "custom1" | "custom2" | "custom3" | "custom4")
name: string // Display name of the status
color: string // Display color of the status ("blue" | "gray" | "red" | "orange" | "yellow" | "green" | "teal" | "indigo" | "purple" | "pink")
isDefault: boolean // Is this a default status
isActive: boolean // Is this (custom) status enabled (always true for default statuses)
inUse: boolean // Is this (custom) status in use (always true for default statuses)
}>
}
```
### Example Request
```bash
curl \
-H "Authorization: ApiKey your.api.key.here" \
https://your-company.your-region-code.qasphere.com/api/public/v0/settings/preferences/status
```
### Example Response
```json
{
"statuses": [
{
"id": "open",
"name": "Open",
"color": "blue",
"isDefault": true,
"isActive": true,
"inUse": true
},
{
"id": "passed",
"name": "Passed",
"color": "green",
"isDefault": true,
"isActive": true,
"inUse": true
},
{
"id": "failed",
"name": "Failed",
"color": "red",
"isDefault": true,
"isActive": true,
"inUse": true
},
{
"id": "skipped",
"name": "Skipped",
"color": "gray",
"isDefault": true,
"isActive": true,
"inUse": true
},
{
"id": "blocked",
"name": "Blocked",
"color": "orange",
"isDefault": true,
"isActive": true,
"inUse": true
},
{
"id": "custom1",
"name": "Known Issue",
"color": "teal",
"isDefault": false,
"isActive": true,
"inUse": true
},
{
"id": "custom2",
"name": "Retest",
"color": "orange",
"isDefault": false,
"isActive": false,
"inUse": false
},
{
"id": "custom3",
"name": "Custom 3",
"color": "purple",
"isDefault": false,
"isActive": true,
"inUse": true
},
{
"id": "custom4",
"name": "Custom 4",
"color": "teal",
"isDefault": false,
"isActive": false,
"inUse": false
}
]
}
```
### Error Responses
| Status Code | Description |
| ----------- | --------------------------------------------- |
| 401 | Invalid or missing API key |
| 403 | Insufficient permissions or suspended tenant |
| 500 | Internal server error while fetching statuses |
## Update Custom Statuses
`POST /api/public/v0/settings/preferences/status`
Update custom statuses.
- Custom statuses apply across the entire account, and any updates will also be reflected in previously added results.
- Once a custom status is enabled and is in use, it cannot be disabled.
### Authentication
Requires an API key with at least Admin role permissions. See [Authentication](https://qasphere.com/docs/api/authentication) for more details.
### Request Body
```typescript
{
statuses: Array<{
id: string // Unique identifier for the custom status ("custom1" | "custom2" | "custom3" | "custom4")
name: string // Display name of the status
color: string // Display color of the status ("blue" | "gray" | "red" | "orange" | "yellow" | "green" | "teal" | "indigo" | "purple" | "pink")
isActive: boolean // Is this custom status enabled
}>
}
```
### Response
Status: 200 OK
```typescript
{
message: 'Statuses updated'
}
```
### Example Request
```bash
curl \
-H "Authorization: ApiKey your.api.key.here" \
-H "Content-Type: application/json" \
-d '{
"statuses": [
{
"id": "custom3",
"name": "Blocker",
"color": "red",
"isActive": true
}
]
}' \
https://your-company.your-region-code.qasphere.com/api/public/v0/settings/preferences/status
```
### Error Responses
| Status Code | Description |
| ----------- | ------------------------------------------------ |
| 400 | Invalid status id or color |
| 401 | Invalid or missing API key |
| 403 | Insufficient permissions or suspended tenant |
| 409 | Trying to update default or in use custom status |
| 500 | Internal server error while updating statuses |
- Custom statuses can only be updated by users with owner or admin roles.
- Custom statuses apply across the entire account, and any updates will also be reflected in previously added results.
- Once a custom status is enabled and used, it cannot be disabled.
---
# Shared Preconditions
URL: /docs/api/shared_preconditions
The shared preconditions endpoints allow you to manage reusable test preconditions that can be referenced across multiple test cases. Shared preconditions consist of a title and text content that describes the initial state or setup required before executing test cases.
## About Shared Preconditions
Shared preconditions are reusable precondition templates that can be used in multiple test cases. They consist of:
1. **Title**: A descriptive name for the shared precondition (required, minimum 1 character)
2. **Text**: The actual precondition content in HTML format (required, minimum 1 character)
When a shared precondition is used in a test case, it provides consistent setup instructions. Updates to a shared precondition automatically propagate to all test cases that reference it.
- Shared preconditions must have both a title and text content
- The title of a shared precondition must be unique within a project
- Shared preconditions are versioned - updates create new versions while preserving old ones
- Deleted preconditions are marked with a `deletedAt` timestamp but remain in the data structure
## List Shared Preconditions
`GET /api/public/v0/project/{project_id}/shared-precondition/paginated`
`/paginated` endpoints are transitional. In API v1, the base paths will return paginated responses and the `/paginated` suffix will be removed.
Retrieves all shared preconditions within a project, optionally sorted and with additional fields included.
### Path Parameters
- `project_id`: The project identifier (can be either the project code or UUID)
### Query Parameters
| Parameter | Type | Description | Default | Example |
| ----------- | ------ | --------------------------------------------------------------------------- | ------- | -------------------- |
| `offset` | number | Number of rows to skip before returning results. | `0` | `offset=10` |
| `limit` | number | Maximum number of rows to return. Accepted range: 0–1,000. | `100` | `limit=20` |
| `sortField` | string | Field to sort by: `created_at` or `title`. | `title` | `sortField=title` |
| `sortOrder` | string | Sort direction for `sortField`: `asc` or `desc`. | `asc` | `sortOrder=asc` |
| `include` | string | Include additional fields omitted by default. Accepted value: `tcaseCount`. | None | `include=tcaseCount` |
- Use `include=tcaseCount` to see how many test cases reference each shared precondition
- Sorting by `created_at` shows the most recently created preconditions first (with `desc`) or oldest first (with `asc`)
- Sorting by `title` provides alphabetical ordering
- If no `sortField` is specified, the default sort is by `title` in ascending order
### Example Request
#### Fetch all shared preconditions
```bash
curl \
-H "Authorization: ApiKey your.api.key.here" \
https://your-company.your-region-code.qasphere.com/api/public/v0/project/BD/shared-precondition/paginated
```
#### Fetch all shared preconditions sorted by title in ascending order
```bash
curl \
-H "Authorization: ApiKey your.api.key.here" \
https://your-company.your-region-code.qasphere.com/api/public/v0/project/BD/shared-precondition/paginated?sortField=title&sortOrder=asc
```
#### Fetch all shared preconditions sorted by creation date (newest first)
```bash
curl \
-H "Authorization: ApiKey your.api.key.here" \
https://your-company.your-region-code.qasphere.com/api/public/v0/project/BD/shared-precondition/paginated?sortField=created_at&sortOrder=desc
```
#### Fetch all shared preconditions with test case count included
```bash
curl \
-H "Authorization: ApiKey your.api.key.here" \
https://your-company.your-region-code.qasphere.com/api/public/v0/project/BD/shared-precondition/paginated?include=tcaseCount
```
### Response Fields
```typescript
{
total: number, // Total number of shared preconditions
offset: number, // The page offset
limit: number, // The page limit
data: Array<{ // List of shared preconditions in the page
projectId: string // Unique identifier of the project
id: number // Unique identifier of the shared precondition
version: number // Version of the shared precondition
title: string // Title of the shared precondition
type: string // Type of the precondition (always "shared" for shared preconditions)
text: html // Text content of the precondition (HTML format)
isLatest: boolean // Whether this is the latest version of the precondition
createdAt: string // Precondition creation time (ISO 8601 format)
updatedAt: string // Precondition updation time (ISO 8601 format)
deletedAt?: string // Date the precondition was deleted on (ISO 8601 format)
tcaseCount?: number // Number of test cases using this shared precondition (only included if requested)
}>
}
```
### Example Response
```json
{
"total": 3,
"offset": 0,
"limit": 100,
"data": [
{
"projectId": "2HKj57k3z_YXYQVTdnPqrs8",
"id": 1,
"version": 2,
"title": "User is logged in",
"type": "shared",
"text": "
The user has valid credentials and is authenticated in the system
",
"isLatest": true,
"createdAt": "2025-01-17T11:20:00.000Z",
"updatedAt": "2025-01-17T11:20:00.000Z",
"tcaseCount": 3
}
]
}
```
## List Shared Preconditions (Deprecated)
**Deprecated**
This endpoint is deprecated. Use [List Shared Preconditions](#list-shared-preconditions) (`GET /api/public/v0/project/{project_id}/shared-precondition/paginated`) instead.
`GET /api/public/v0/project/{project_id}/shared-precondition`
Retrieves all shared preconditions within a project, optionally sorted and with additional fields included.
### Path Parameters
- `project_id`: The project identifier (can be either the project code or UUID)
### Query Parameters
All query parameters are optional.
| Parameter | Type | Description | Allowed Values | Example |
| ----------- | ------ | ---------------------------------------------------------------------- | --------------------- | -------------------- |
| `sortField` | string | Field to sort by | `created_at`, `title` | `sortField=title` |
| `sortOrder` | string | Sort order (requires `sortField`; default: `desc`) | `asc`, `desc` | `sortOrder=asc` |
| `include` | string | Include additional fields in the response which are omitted by default | `tcaseCount` | `include=tcaseCount` |
- Use `include=tcaseCount` to see how many test cases reference each shared precondition
- Sorting by `created_at` shows the most recently created preconditions first (with `desc`) or oldest first (with `asc`)
- Sorting by `title` provides alphabetical ordering
- If no `sortField` is specified, the default sort is by `title` in ascending order
### Example Request
#### Fetch all shared preconditions
```bash
curl \
-H "Authorization: ApiKey your.api.key.here" \
https://your-company.your-region-code.qasphere.com/api/public/v0/project/BD/shared-precondition
```
#### Fetch all shared preconditions sorted by title in ascending order
```bash
curl \
-H "Authorization: ApiKey your.api.key.here" \
https://your-company.your-region-code.qasphere.com/api/public/v0/project/BD/shared-precondition?sortField=title&sortOrder=asc
```
#### Fetch all shared preconditions sorted by creation date (newest first)
```bash
curl \
-H "Authorization: ApiKey your.api.key.here" \
https://your-company.your-region-code.qasphere.com/api/public/v0/project/BD/shared-precondition?sortField=created_at&sortOrder=desc
```
#### Fetch all shared preconditions with test case count included
```bash
curl \
-H "Authorization: ApiKey your.api.key.here" \
https://your-company.your-region-code.qasphere.com/api/public/v0/project/BD/shared-precondition?include=tcaseCount
```
### Response Fields
```typescript
Array<{
// List of shared precondition objects
projectId: string // Unique identifier of the project
id: number // Unique identifier of the shared precondition
version: number // Version of the shared precondition
title: string // Title of the shared precondition
type: string // Type of the precondition (always "shared" for shared preconditions)
text: html // Text content of the precondition (HTML format)
isLatest: boolean // Whether this is the latest version of the precondition
createdAt: string // Precondition creation time (ISO 8601 format)
updatedAt: string // Precondition updation time (ISO 8601 format)
deletedAt?: string // Date the precondition was deleted on (ISO 8601 format)
tcaseCount?: number // Number of test cases using this shared precondition (only included if requested)
}>
```
### Example Response
```json
[
{
"projectId": "2HKj57k3z_YXYQVTdnPqrs8",
"id": 1,
"version": 2,
"title": "User is logged in",
"type": "shared",
"text": "
The user has valid credentials and is authenticated in the system
",
"isLatest": true,
"createdAt": "2025-01-17T11:20:00.000Z",
"updatedAt": "2025-01-17T11:20:00.000Z",
"tcaseCount": 3
}
]
```
## Get Shared Precondition
`GET /api/public/v0/project/{project_id}/shared-precondition/{shared_precondition_id}`
Get details of a single shared precondition using its ID.
### Path Parameters
- `project_id`: The project identifier (can be either the project code or UUID)
- `shared_precondition_id`: The shared precondition identifier (numeric ID)
### Example Request
```bash
curl \
-H "Authorization: ApiKey your.api.key.here" \
https://your-company.your-region-code.qasphere.com/api/public/v0/project/BD/shared-precondition/1
```
### Response Fields
```typescript
{
projectId: string // Unique identifier of the project
id: number // Unique identifier of the shared precondition
version: number // Version of the shared precondition
title: string // Title of the shared precondition
type: string // Type of the precondition (always "shared" for shared preconditions)
text: html // Text content of the precondition (HTML format)
isLatest: boolean // Whether this is the latest version of the precondition
createdAt: string // Precondition creation time (ISO 8601 format)
updatedAt: string // Precondition updation time (ISO 8601 format)
deletedAt?: string // Date the precondition was deleted on (ISO 8601 format)
}
```
### Example Response
```json
{
"projectId": "2HKj57k3z_YXYQVTdnPqrs8",
"id": 1,
"version": 2,
"title": "User is logged in",
"type": "shared",
"text": "
The user has valid credentials and is authenticated in the system
",
"isLatest": true,
"createdAt": "2025-01-15T10:30:00.000Z",
"updatedAt": "2025-01-20T14:45:00.000Z"
}
```
---
# Shared Steps
URL: /docs/api/shared_steps
The shared steps endpoints allow you to manage reusable test steps that can be referenced across multiple test cases. Shared steps consist of a title and a list of sub-steps, each with a description and expected result.
## About Shared Steps
Shared steps are reusable test step templates that can be used in multiple test cases. They consist of:
1. **Title**: A descriptive name for the shared step (1-255 characters)
2. **Sub-steps**: A list of individual steps, each with:
- **Description**: What action to perform (HTML content)
- **Expected**: The expected result (HTML content)
- **Test data** (optional): A list of up to 20 test data items (`text`, `link`, or `file`), returned in the `data` field — see the Step Test Data section of the [Test Cases](/docs/api/tcases/#step-test-data) page for the item shape
When a shared step is used in a test case, all its sub-steps are included. Updates to a shared step automatically propagate to all test cases that reference it.
- Shared steps must have at least one sub-step
- Each sub-step must have at least a description, expected result, or test data
- The title of a shared step must be unique within a project
- Shared steps are versioned - updates create new versions while preserving old ones
- Deleted shared steps are still returned by test case versions that reference them, with `deletedAt` set on the shared step and its sub-steps
## List Shared Steps
`GET /api/public/v0/project/{project_id}/shared-step/paginated`
`/paginated` endpoints are transitional. In API v1, the base paths will return paginated responses and the `/paginated` suffix will be removed.
Retrieves all non-deleted shared steps within a project, optionally sorted and with additional fields included.
### Path Parameters
- `project_id`: The project identifier (can be either the project code or UUID)
### Query Parameters
| Parameter | Type | Description | Default | Example |
| ----------- | ------ | --------------------------------------------------------------------------- | ------- | -------------------- |
| `offset` | number | Number of rows to skip before returning results. | `0` | `offset=10` |
| `limit` | number | Maximum number of rows to return. Accepted range: 0–1,000. | `100` | `limit=20` |
| `sortField` | string | Field to sort by: `created_at` or `title`. | `title` | `sortField=title` |
| `sortOrder` | string | Sort direction for `sortField`: `asc` or `desc`. | `asc` | `sortOrder=asc` |
| `include` | string | Include additional fields omitted by default. Accepted value: `tcaseCount`. | None | `include=tcaseCount` |
- Use `include=tcaseCount` to see how many test cases reference each shared step
- Sorting by `created_at` shows the most recently created steps first (with `desc`) or oldest first (with `asc`)
- Sorting by `title` provides alphabetical ordering
### Example Request
#### Fetch all shared steps
```bash
curl \
-H "Authorization: ApiKey your.api.key.here" \
https://your-company.your-region-code.qasphere.com/api/public/v0/project/BD/shared-step/paginated
```
#### Fetch all shared steps sorted by title in ascending order
```bash
curl \
-H "Authorization: ApiKey your.api.key.here" \
https://your-company.your-region-code.qasphere.com/api/public/v0/project/BD/shared-step/paginated?sortField=title&sortOrder=asc
```
#### Fetch all shared steps with test case count included
```bash
curl \
-H "Authorization: ApiKey your.api.key.here" \
https://your-company.your-region-code.qasphere.com/api/public/v0/project/BD/shared-step/paginated?include=tcaseCount
```
### Response Fields
```typescript
{
total: number, // Total number of shared steps
offset: number, // The page offset
limit: number, // The page limit
data: Array<{ // List of shared steps in the page
id: number // Unique identifier of the shared step
version: number // Version of the shared step
type: string // Type of the step (always "shared" for shared steps)
title: string // Title of the shared step
isLatest: boolean // Whether this is the latest version of the step
subSteps: Array<{ // List of sub-steps
id: number // Unique identifier of the sub-step
type: string // Type of the step (always "shared_sub_step")
version: number // Version of the step (same as parent step)
isLatest: boolean // Whether this is the latest version (same as parent step)
description: html // Details of the sub-step
expected: html // Expected result from the sub-step
data?: Array // Sub-step test data items (see Step Test Data on the Test Cases page)
deletedAt?: string // Date the sub-step was deleted on (ISO 8601 format)
}>
deletedAt?: string // Date the shared step was deleted on (ISO 8601 format)
tcaseCount?: number // Number of test cases using this shared step (only included if requested)
}>
}
```
### Example Response
```json
{
"total": 2,
"offset": 0,
"limit": 100,
"data": [
{
"id": 1,
"version": 3,
"type": "shared",
"title": "User login validation",
"isLatest": true,
"subSteps": [
{
"id": 2,
"type": "shared_sub_step",
"version": 3,
"isLatest": true,
"description": "
"
}
],
"tcaseCount": 12
}
]
}
```
## List Shared Steps (Deprecated)
**Deprecated**
This endpoint is deprecated. Use [List Shared Steps](#list-shared-steps) (`GET /api/public/v0/project/{project_id}/shared-step/paginated`) instead.
`GET /api/public/v0/project/{project_id}/shared-step`
Retrieves all non deleted shared steps within a project, optionally sorted and with additional fields included.
### Path Parameters
- `project_id`: The project identifier (can be either the project code or UUID)
### Query Parameters
All query parameters are optional.
| Parameter | Type | Description | Allowed Values | Example |
| ----------- | ------ | ---------------------------------------------------------------------- | --------------------- | -------------------- |
| `sortField` | string | Field to sort by | `created_at`, `title` | `sortField=title` |
| `sortOrder` | string | Sort order (requires `sortField`; default: `desc`) | `asc`, `desc` | `sortOrder=asc` |
| `include` | string | Include additional fields in the response which are omitted by default | `tcaseCount` | `include=tcaseCount` |
- Use `include=tcaseCount` to see how many test cases reference each shared step
- Sorting by `created_at` shows the most recently created steps first (with `desc`) or oldest first (with `asc`)
- Sorting by `title` provides alphabetical ordering
### Example Request
#### Fetch all shared steps
```bash
curl \
-H "Authorization: ApiKey your.api.key.here" \
https://your-company.your-region-code.qasphere.com/api/public/v0/project/BD/shared-step
```
#### Fetch all shared steps sorted by title in ascending order
```bash
curl \
-H "Authorization: ApiKey your.api.key.here" \
https://your-company.your-region-code.qasphere.com/api/public/v0/project/BD/shared-step?sortField=title&sortOrder=asc
```
#### Fetch all shared steps with test case count included
```bash
curl \
-H "Authorization: ApiKey your.api.key.here" \
https://your-company.your-region-code.qasphere.com/api/public/v0/project/BD/shared-step?include=tcaseCount
```
### Response Fields
```typescript
{
sharedSteps: Array<{
// List of shared step objects
id: number // Unique identifier of the shared step
version: number // Version of the shared step
type: string // Type of the step (always "shared" for shared steps)
title: string // Title of the shared step
isLatest: boolean // Whether this is the latest version of the step
subSteps: Array<{
// List of sub-steps
id: number // Unique identifier of the sub-step
type: string // Type of the step (always "shared_sub_step")
version: number // Version of the step (same as parent step)
isLatest: boolean // Whether this is the latest version (same as parent step)
description: html // Details of the sub-step
expected: html // Expected result from the sub-step
data?: Array // Sub-step test data items (see Step Test Data on the Test Cases page)
deletedAt?: string // Date the sub-step was deleted on (ISO 8601 format)
}>
deletedAt?: string // Date the shared step was deleted on (ISO 8601 format)
tcaseCount?: number // Number of test cases using this shared step (only included if requested)
}>
}
```
### Example Response
```json
{
"sharedSteps": [
{
"id": 1,
"version": 3,
"type": "shared",
"title": "User login validation",
"isLatest": true,
"subSteps": [
{
"id": 2,
"type": "shared_sub_step",
"version": 3,
"isLatest": true,
"description": "
"
}
],
"tcaseCount": 12
}
]
}
```
## Get Shared Step
`GET /api/public/v0/project/{project_id}/shared-step/{step_id}`
Get details of a single shared step using its ID.
### Path Parameters
- `project_id`: The project identifier (can be either the project code or UUID)
- `step_id`: The shared step identifier (numeric ID)
### Example Request
```bash
curl \
-H "Authorization: ApiKey your.api.key.here" \
https://your-company.your-region-code.qasphere.com/api/public/v0/project/BD/shared-step/1
```
### Response Fields
```typescript
{
id: number // Unique identifier of the shared step
version: number // Version of the shared step
type: string // Type of the step (always "shared" for shared steps)
title: string // Title of the shared step
isLatest: boolean // Whether this is the latest version of the step
subSteps: Array<{ // List of sub-steps
id: number // Unique identifier of the sub-step
type: string // Type of the step (always "shared_sub_step")
version: number // Version of the step (same as parent step)
description: html // Details of the sub-step
expected: html // Expected result from the sub-step
data?: Array // Sub-step test data items (see Step Test Data on the Test Cases page)
deletedAt?: string // Date the sub-step was deleted on (ISO 8601 format)
}>
isLatest: boolean // Whether this is the latest version (same as parent step)
deletedAt?: string // Date the shared step was deleted on (ISO 8601 format)
}
```
### Example Response
```json
{
"id": 1,
"version": 3,
"type": "shared",
"title": "User login validation",
"isLatest": true,
"subSteps": [
{
"id": 2,
"type": "shared_sub_step",
"version": 3,
"isLatest": true,
"description": "
"
}
]
}
```
---
# Tags
URL: /docs/api/tag
Tags help organize and categorize test cases within your project. You can use tags in query plans to filter test cases when creating runs.
## List Tags
`GET /api/public/v0/project/{project_id}/tag/paginated`
`/paginated` endpoints are transitional. In API v1, the base paths will return paginated responses and the `/paginated` suffix will be removed.
Returns all tags defined in the project. This endpoint is particularly useful when creating run query plans that filter test cases by tags.
### Path Parameters
- `project_id`: The project identifier (can be either the project code or UUID)
### Query Parameters
| Parameter | Type | Description | Default | Example |
| ----------- | ------ | --------------------------------------------------------------------------- | ------- | -------------------- |
| `offset` | number | Number of rows to skip before returning results. | `0` | `offset=10` |
| `limit` | number | Maximum number of rows to return. Accepted range: 0–1,000. | `100` | `limit=20` |
| `sortField` | string | Field to sort by: `created_at` or `title`. | `title` | `sortField=title` |
| `sortOrder` | string | Sort direction for `sortField`: `asc` or `desc`. | `asc` | `sortOrder=asc` |
| `include` | string | Include additional fields omitted by default. Accepted value: `tcaseCount`. | None | `include=tcaseCount` |
### Response
Status: 200 OK
```typescript
{
total: number, // Total number of tags
offset: number, // The page offset
limit: number, // The page limit
data: Array<{ // List of tags in the page
id: number // Unique tag identifier within the project
title: string // Tag label
tcaseCount?: number // Number of test cases using this tag (only included if requested)
}>
}
```
### Example Request
```bash
curl \
-H "Authorization: ApiKey your.api.key.here" \
https://your-company.your-region-code.qasphere.com/api/public/v0/project/BD/tag/paginated
```
### Example Response
```json
{
"total": 3,
"offset": 0,
"limit": 100,
"data": [
{
"id": 1,
"title": "regression"
},
{
"id": 2,
"title": "api-tests"
},
{
"id": 3,
"title": "smoke-tests"
}
]
}
```
### Error Responses
| Status Code | Description |
| ----------- | -------------------------------------------- |
| 401 | Invalid or missing API key |
| 403 | Insufficient permissions or suspended tenant |
| 404 | Project not found |
| 500 | Internal server error |
### Using Tags in Run Query Plans
Tags returned by this endpoint can be used in run query plans to filter test cases. For example:
```json
{
"title": "API Regression Run",
"type": "live",
"queryPlans": [
{
"folderIds": [1],
"tagIds": [2], // Using the tag ID for "api-tests"
"priorities": ["high"]
}
]
}
```
Tag IDs are unique within a project but not across projects. Always verify you're using tag IDs from the correct project.
**Using Multiple Tags**
You can include multiple tag IDs in a query plan to select test cases that have any of the specified tags.
```json
{
"tagIds": [2, 3] // Selects test cases with either "api-tests" or "smoke-tests" tags
}
```
## List Tags (Deprecated)
**Deprecated**
This endpoint is deprecated. Use [List Tags](#list-tags) (`GET /api/public/v0/project/{project_id}/tag/paginated`) instead.
`GET /api/public/v0/project/{project_id}/tag`
Returns all tags defined in the project. This endpoint is particularly useful when creating run query plans that filter test cases by tags.
### Path Parameters
- `project_id`: The project identifier (can be either the project code or UUID)
### Response
Status: 200 OK
```typescript
{
tags: Array<{
id: number // Unique tag identifier within the project
title: string // Tag name/label
}>
}
```
### Example Request
```bash
curl \
-H "Authorization: ApiKey your.api.key.here" \
https://your-company.your-region-code.qasphere.com/api/public/v0/project/BD/tag
```
### Example Response
```json
{
"tags": [
{
"id": 1,
"title": "regression"
},
{
"id": 2,
"title": "api-tests"
},
{
"id": 3,
"title": "smoke-tests"
}
]
}
```
### Error Responses
| Status Code | Description |
| ----------- | -------------------------------------------- |
| 401 | Invalid or missing API key |
| 403 | Insufficient permissions or suspended tenant |
| 404 | Project not found |
| 500 | Internal server error |
---
# Test Cases
URL: /docs/api/tcases
The test cases endpoints allow you to retrieve information about test cases in your project. This can be useful for planning test runs and monitoring your test coverage.
## Types of Test Cases
In QA Sphere, there are three types of test cases:
1. **Standalone Test Case**: These are the standard test cases.
2. **Template Test Case**: Similar to standalone test cases, but they can include parameters within `${}` in their title, preconditions, and steps. These parameters can be replaced with specific values to generate multiple test cases from the same template.
3. **Filled Test Cases**: Automatically created by the system by substituting parameter values in template test cases. They inherit all properties from the parent template test case.
- Users can directly create standalone and template test cases. When creating template test cases, users can specify a list of values for the parameters, which the system uses to automatically generate the corresponding filled test cases.
- Updates to a template test case will also update the corresponding filled test cases.
- Deletion is permitted for all three types of test cases. Deleting a template test case will also delete the associated filled test cases. Deleting a filled test case will only remove that specific test case.
- Test runs include only standalone and filled test cases.
## Step Test Data
Each standalone step (and each sub-step of a shared step) can carry a list of test data items in its `data` field. Every item is one of three types, discriminated by `type`:
```typescript
{
type: string // Required: `text` | `link` | `file`
label?: string // Optional: Item label (max 255 characters, trimmed)
data: // Required: Value, shape depends on `type`
| { value: string, format?: string } // text: required content (max 65535 UTF-16 code units) with an optional language hint (max 32 characters; see below)
| { value: string } // link: an http(s) URL (max 255 characters)
| { value: File } // file: a file object (`id`, `fileName`, `mimeType`, `size`, `stableUrl`, `url`), same shape as test case `files`
}
```
- A step can have at most 20 test data items.
- `text` items must have a non-empty `value` of at most 65,535 UTF-16 code units. `format` is a language hint for syntax highlighting (e.g. `plaintext`, `json`, `sql`); an unsupported value falls back to plain text.
- For `file` items, upload the file first using the upload file endpoint, then pass the object it returns as the item's `value`.
- A step is kept when it has a description, an expected result, **or** test data, so a step carrying only `data` is valid.
- Test data belongs to standalone steps and to shared step sub-steps. A step that references a shared step by `sharedStepId` must not send `data` — the shared step owns the data on its sub-steps, and sending both is rejected.
- Shared steps and their test data are managed through the web UI; the public API returns sub-step `data` in read responses.
## List Test Cases
`GET /api/public/v0/project/{project_id}/tcase/paginated`
`/paginated` endpoints are transitional. In API v1, the base paths will return paginated responses and the `/paginated` suffix will be removed.
Retrieves all test cases within a project based on the filters provided in the request query parameters.
### Path Parameters
- `project_id`: The project identifier (can be either the project code or UUID)
### Query Parameters
Some query parameters can be specified multiple times using the format `param=value1¶m=value2¶m=value3`.
| Parameter | Type | Description | Default | Example |
| -------------------------------- | ------ | ------------------------------------------------------------------------------------------------------------------------------------------------------------------------------------------------------------ | --------- | ------------------------------------------ |
| `types` | string | Filter by type: `standalone`, `template`, or `filled`. Repeat the parameter for multiple values; multiple values use OR logic. | No filter | `types=standalone` |
| `search` | string | Filter by title using case-insensitive partial matching. | No filter | `search=ui` |
| `folders` | number | Filter by folder ID without including child folders. Repeat the parameter for multiple IDs; multiple values use OR logic. | No filter | `folders=10&folders=12` |
| `tags` | number | Filter by tag ID. Repeat the parameter for multiple IDs; multiple values use OR logic. | No filter | `tags=12` |
| `priorities` | string | Filter by priority: `high`, `medium`, or `low`. Repeat the parameter for multiple values; multiple values use OR logic. | No filter | `priorities=low` |
| `draft` | bool | Filter by draft status: `true` or `false`. | No filter | `draft=true` |
| `templateTCaseIds` | string | Filter by parent template test case ID. Repeat the parameter for multiple IDs; multiple values use OR logic. | No filter | `templateTCaseIds=1CEPaUhuR_yNsLvcbYJhw46` |
| `requirementIds` | string | Filter by requirement ID. Repeat the parameter for multiple IDs; multiple values use OR logic. | No filter | `requirementIds=1CEPaUhuR_abc123def456` |
| `cf_${custom field system name}` | string | Filter by a value defined under Settings > Custom Fields. Repeat the parameter for multiple values; multiple values use OR logic. | No filter | `cf_automation=Automated` |
| `offset` | number | Number of rows to skip before returning results. | `0` | `offset=10` |
| `limit` | number | Maximum number of test cases to return. Accepted range: 0–1,000. | `100` | `limit=10` |
| `sortField` | string | Field to sort by: `id`, `seq`, `folder_id`, `author_id`, `pos`, `title`, `priority`, `created_at`, `updated_at`, or `legacy_id`. | `pos` | `sortField=title` |
| `sortOrder` | string | Sort direction for `sortField`: `asc` or `desc`. | `asc` | `sortOrder=desc` |
| `include` | string | Include fields omitted by default: `precondition`, `steps`, `tags`, `project`, `folder`, `path`, `requirements`, `customFields`, `filterableCustomFields`, or `parameterValues`. Repeat for multiple values. | None | `include=steps` |
- Use pagination when project contains large number of test cases
- Only include necessary non-default fields
- Different filters are combined with AND logic
- Multiple values for the same filter are combined with OR logic
### Example Request
#### Fetch all test cases with default fields
```bash
curl \
-H "Authorization: ApiKey your.api.key.here" \
https://your-company.your-region-code.qasphere.com/api/public/v0/project/BD/tcase/paginated
```
#### Fetch all test cases with "Automation" custom field to be "Automated"
```bash
curl \
-H "Authorization: ApiKey your.api.key.here" \
https://your-company.your-region-code.qasphere.com/api/public/v0/project/BD/tcase/paginated?cf_automation=Automated
```
#### Fetch all test cases with "Known Issue" custom field to be "Yes"
```bash
curl \
-H "Authorization: ApiKey your.api.key.here" \
https://your-company.your-region-code.qasphere.com/api/public/v0/project/BD/tcase/paginated?cf_known_issue=Yes
```
#### Fetch 20 test cases sorted by title in ascending order
```bash
curl \
-H "Authorization: ApiKey your.api.key.here" \
https://your-company.your-region-code.qasphere.com/api/public/v0/project/BD/tcase/paginated?limit=20&sortField=title&sortOrder=asc
```
#### Skip the first 90 test cases and return the next 15 — or, return 15 rows starting from 0-based index 90
```bash
curl \
-H "Authorization: ApiKey your.api.key.here" \
https://your-company.your-region-code.qasphere.com/api/public/v0/project/BD/tcase/paginated?offset=90&limit=15&sortField=pos&sortOrder=asc
```
#### Fetch all draft test cases
```bash
curl \
-H "Authorization: ApiKey your.api.key.here" \
https://your-company.your-region-code.qasphere.com/api/public/v0/project/BD/tcase/paginated?draft=true
```
#### Fetch 10 most recent added test cases
```bash
curl \
-H "Authorization: ApiKey your.api.key.here" \
https://your-company.your-region-code.qasphere.com/api/public/v0/project/BD/tcase/paginated?limit=10&sortField=created_at&sortOrder=desc
```
#### Fetch test cases with "backend" in their title
```bash
curl \
-H "Authorization: ApiKey your.api.key.here" \
https://your-company.your-region-code.qasphere.com/api/public/v0/project/BD/tcase/paginated?search=backend
```
#### Fetch test cases with "backend" in their title and include custom fields
```bash
curl \
-H "Authorization: ApiKey your.api.key.here" \
https://your-company.your-region-code.qasphere.com/api/public/v0/project/BD/tcase/paginated?search=backend&include=customFields
```
#### Fetch all filled test cases corresponding to template test case ID '1CEPaUhuR_yNsLvcbYJhw46'
```bash
curl \
-H "Authorization: ApiKey your.api.key.here" \
https://your-company.your-region-code.qasphere.com/api/public/v0/project/BD/tcase/paginated?templateTCaseIds=1CEPaUhuR_yNsLvcbYJhw46
```
#### Fetch test cases linked to a specific requirement
```bash
curl \
-H "Authorization: ApiKey your.api.key.here" \
https://your-company.your-region-code.qasphere.com/api/public/v0/project/BD/tcase/paginated?requirementIds=1CEPaUhuR_abc123def456
```
#### Fetch test cases linked to multiple requirements (OR logic)
```bash
curl \
-H "Authorization: ApiKey your.api.key.here" \
"https://your-company.your-region-code.qasphere.com/api/public/v0/project/BD/tcase/paginated?requirementIds=1CEPaUhuR_abc123def456&requirementIds=1CEPaUhuR_xyz789ghi012"
```
### Response Fields
```typescript
{
total: number, // Total number of test cases
offset: number, // The page offset
limit: number, // The page limit
data: Array<{ // List of test cases in the page
id: string // Unique identifier of the test case
legacyId: string // Legacy identifier of the test case. Empty string if the test case has no legacy ID
version: number // Version of the test case. Updates to test (except folder/pos) creates a new version
type: string // Type of the test case (`standalone` | `template` | `filled`)
title: string // Title of the test case
seq: number // Sequence number of the test case. Test cases in a project are assigned incremental sequence numbers
folderId: number // Identifier of the folder where the test case is placed
pos: number // Ordered position (0 based) of the test case in its folder
priority: string // Priority of the test case (`high` | `medium` | `low`)
comment: html // Test case precondition text. DEPRECATED, usable but prefer precondition object below
precondition: {
projectId: string, // Project id the precondition belongs to. Same as test cases'
id: number, // Id of the precondition. Not useful unless the precondition is shared
version: number, // Version of the precondition
title?: string, // Title of the precondition. Only populated for shared
type: 'standalone' | 'shared', // Type of the precondition
text: html, // Actual text contents of the precondition
isLatest: boolean, // Whether precondition's version is latest or not
createdAt: string,
updatedAt: string,
deletedAt?: string,
}
files: Array<{ // List of files attached to the test case
id: string // Unique identifier of the file
fileName: string // Name of the file
mimeType: string // Mime type of the file
size: number // Size of the file
url: string // URL of the file
}>
links: Array<{ // Additional links relevant to the test case
text: string // Title of the link
url: string // URL of the link
}>
authorId: number // Unique identifier of the user who added the test case
isDraft: boolean // Whether the test case is still in draft state
isLatestVersion: boolean // Whether this is the latest version of the test case
isEmpty: boolean // Whether the test case is empty (has no comment and steps)
templateTCaseId?: string // Corresponding template test case ID, if it is a filled test case
numFilledTCases? number // Number of corresponding filled test cases, if it is a template test case
createdAt: string // Test case creation time (ISO 8601 format)
updatedAt: string // Test case updation time (ISO 8601 format)
// Non default fields
customFields: { // Custom fields defined for the test case
[key: string]: { // Key-value pairs of custom field system names and corresponding details for the test case
value: string // Current value
isDefault: boolean // Whether default value is set by the system or selected by the user
}
}
tags: Array<{ // List of test case tags
id: number // Unique identifier of the tag
title: string // Title of the tag
}>
steps: Array<{ // List of test case steps
id: number // Unique identifier of the step
type: string // Type of the step (standalone | shared)
version: number // Version of the step (always 1 for standalone steps)
isLatest: boolean // Whether this is the latest version of the step (always true for standalone steps)
title?: string // Title of the step (only for shared steps)
subSteps?: Array<{ // List of sub steps (only for shared steps)
id: number // Unique identifier of the step
type: string // Type of the step (shared_sub_step)
version: number // Version of the step (same as parent step)
isLatest: boolean // Whether this is the latest version (same as parent step)
description: html // Details of the sub step
expected: html // Expected result from the sub step
data?: Array // Sub step test data items (see Step Test Data)
deletedAt?: string // Date the sub step was deleted on
}>
description?: html // Details of step (only for standalone steps)
expected?: html // Expected result from the step (only for standalone steps)
data?: Array // Step test data items, only for standalone steps (see Step Test Data)
deletedAt?: string // Date the step was deleted on
}>
requirements: Array<{ // Test case requirement (currently only single requirement is supported on UI)
id: string // Unique identifier of the requirement
text: string // Title of the requirement
url: string // URL of the requirement
}>
parameterValues: { // The details of corresponding filled tcases (relevant only for template tcases)
tcaseId: string // ID of the filled tcase
tcaseVersion: number // Version of the filled tcase
values: { // Values corresponding to the parameters in the template tcase for this filled tcase
[key: string]: string
}
}
folder: { // Details of the folder where the test case is placed
id: number // Unique identifier for the folder
title: string // Name of the folder
comment: html // Additional notes or description
pos: number // Position of the folder among its siblings
parentId: number // ID of the parent folder (0 for root folders)
projectId: string // ID of the project the folder belongs to
},
path: Array<{ // Path to the folder where the test cases is placed
id: number // Unique identifier for the folder
title: string // Name of the folder
comment: html // Additional notes or description
pos: number // Position of the folder among its siblings
parentId: number // ID of the parent folder (0 for root folders)
projectId: string // ID of the project the folder belongs to
}>
project: { // Details of project to which the test case belong
id: string // Unique identifier of the project
code: string // Short code of the project
title: string // Title of the project
overviewTitle: string // Title of the project overview
overviewDescription: html // Project Overview
links: { // Links relevant to the project
text: string // Title of the link
url: string // URL of the link
}
archivedAt: string // Project archival time (ISO 8601 format)
createdAt: string // Project creation time (ISO 8601 format)
updatedAt: string // Project updation time (ISO 8601 format)
}
}>
}
```
### Example Response
```json
{
"total": 4,
"offset": 1,
"limit": 2,
"data": [
{
"id": "1CJg36j1c_yFYPRcmZaoqp3",
"version": 6,
"legacyId": "",
"seq": 55,
"type": "standalone",
"folderId": 26,
"pos": 0,
"title": "User should see the content according to the \"About Us\" information",
"priority": "high",
"comment": "
",
"isLatest": true,
"createdAt": "2025-03-25T10:48:34.66935+02:00",
"updatedAt": "2025-03-25T10:48:34.66935+02:00"
},
"authorId": 1,
"files": [
{
"id": "89f7a73e-043c-4fe1-beb3-9e8d8df55f28",
"fileName": "Screencast from 24-03-25 14:27:33.webm",
"mimeType": "video/webm",
"size": 555431
}
],
"links": [],
"isDraft": false,
"isLatestVersion": true,
"isEmpty": false,
"createdAt": "2025-03-25T10:48:14.243475+02:00",
"updatedAt": "2025-03-25T10:48:14.243475+02:00"
},
{
"id": "1CJg36j28_EaAHxNiNQNNTn",
"version": 6,
"legacyId": "",
"seq": 56,
"type": "standalone",
"folderId": 26,
"pos": 1,
"title": "User should place the order successfully after entering valid data in all required fields and selecting the \"Card Payment\" payment",
"priority": "high",
"comment": "
The \"Checkout\" page is opened
There are pizzas, drinks and desserts
",
"authorId": 1,
"files": [
{
"id": "bf5fcc05-44a2-46b2-87fb-2501cfedb1f7",
"fileName": "Screenshot 2025-01-15 18:54:44.png",
"mimeType": "image/png",
"size": 89567
}
],
"links": [],
"isDraft": false,
"isLatestVersion": true,
"isEmpty": false,
"createdAt": "2025-03-25T10:48:34.66935+02:00",
"updatedAt": "2025-03-25T10:48:34.66935+02:00"
}
]
}
```
## List Test Cases (Deprecated)
**Deprecated**
This endpoint is deprecated. Use [List Test Cases](#list-test-cases) (`GET /api/public/v0/project/{project_id}/tcase/paginated`) instead.
`GET /api/public/v0/project/{project_id}/tcase`
Retrieves all test cases within a project based on the filters provided in the request query parameters.
### Path Parameters
- `project_id`: The project identifier (can be either the project code or UUID)
### Query Parameters
All query parameters are optional and some can be specified multiple times using the format `param=value1¶m=value2¶m=value3`.
| Parameter | Type | Multiple | Description | Allowed Values | Example |
| -------------------------------- | ------ | -------- | -------------------------------------------------------------------------------------------------------------------------------------------- | ------------------------------------------------------------------------------------------------------------------------- | ------------------------------------------ |
| `offset` | number | no | Number of rows to skip before returning results. Combine with `limit` for offset-based pagination. | | `offset=10` |
| `limit` | number | no | Maximum number of test cases to return (0–5000). May be `0` to return only the total count (no rows). | | `limit=10` |
| `page` | number | no | **Deprecated** — use `offset` instead. 1-based page number. Ignored when `offset` is set. If `limit` is omitted, a default of 10 is applied. | | `page=1` |
| `sortField` | string | no | Field to sort by | `id`, `seq`, `folder_id`, `author_id`, `pos`, `title`, `priority`, `created_at`, `updated_at`, `legacy_id` | `sortField=title` |
| `sortOrder` | string | no | Sort order (requires `sortField`; default: `desc`) | `asc`, `desc` | `sortOrder=desc` |
| `types` | string | yes | Filter test cases by type | `standalone`, `template`, `filled` | `types=standalone` |
| `search` | string | no | Filter test cases by title (case insensitive, partial matches) | | `search=ui` |
| `folders` | number | yes | Filter test cases by folder ID (does not consider child folders) | | `folders=10&folders=12` |
| `tags` | number | yes | Filter test cases by tag ID | | `tags=12` |
| `priorities` | string | yes | Filter test cases by priority | `high`, `medium`, `low` | `priorities=low` |
| `draft` | bool | no | Filter test cases by draft status | `true`, `false` | `draft=true` |
| `templateTCaseIds` | string | yes | Filter test cases by their parent template test case identifiers | | `templateTCaseIds=1CEPaUhuR_yNsLvcbYJhw46` |
| `requirementIds` | string | yes | Filter test cases by requirement ID | | `requirementIds=1CEPaUhuR_abc123def456` |
| `cf_${custom field system name}` | string | yes | Filter test cases by custom field value | The values for custom fields are defined under Settings > Custom Fields | `cf_automation=Automated` |
| `include` | string | yes | Include additional fields in the response which are omitted by default | `steps`, `tags`, `project`, `folder`, `path`, `requirements`, `customFields`, `filterableCustomFields`, `parameterValues` | `include=steps` |
- Use pagination when project contains large number of test cases
- Only include necessary non-default fields
- Different filters are combined with AND logic
- Multiple values for the same filter are combined with OR logic
### Example Request
#### Fetch all test cases with default fields
```bash
curl \
-H "Authorization: ApiKey your.api.key.here" \
https://your-company.your-region-code.qasphere.com/api/public/v0/project/BD/tcase
```
#### Fetch all test cases with "Automation" custom field to be "Automated"
```bash
curl \
-H "Authorization: ApiKey your.api.key.here" \
https://your-company.your-region-code.qasphere.com/api/public/v0/project/BD/tcase?cf_automation=Automated
```
#### Fetch all test cases with "Known Issue" custom field to be "Yes"
```bash
curl \
-H "Authorization: ApiKey your.api.key.here" \
https://your-company.your-region-code.qasphere.com/api/public/v0/project/BD/tcase?cf_known_issue=Yes
```
#### Fetch 20 test cases sorted by title in ascending order
```bash
curl \
-H "Authorization: ApiKey your.api.key.here" \
https://your-company.your-region-code.qasphere.com/api/public/v0/project/BD/tcase?limit=20&sortField=title&sortOrder=asc
```
#### Skip the first 90 test cases and return the next 15 — or, return 15 rows starting from 0-based index 90
```bash
curl \
-H "Authorization: ApiKey your.api.key.here" \
https://your-company.your-region-code.qasphere.com/api/public/v0/project/BD/tcase?offset=90&limit=15&sortField=pos&sortOrder=asc
```
#### Fetch all draft test cases
```bash
curl \
-H "Authorization: ApiKey your.api.key.here" \
https://your-company.your-region-code.qasphere.com/api/public/v0/project/BD/tcase?draft=true
```
#### Fetch 10 most recent added test cases
```bash
curl \
-H "Authorization: ApiKey your.api.key.here" \
https://your-company.your-region-code.qasphere.com/api/public/v0/project/BD/tcase?limit=10&sortField=created_at&sortOrder=desc
```
#### Fetch test cases with "backend" in their title
```bash
curl \
-H "Authorization: ApiKey your.api.key.here" \
https://your-company.your-region-code.qasphere.com/api/public/v0/project/BD/tcase?search=backend
```
#### Fetch test cases with "backend" in their title and include custom fields
```bash
curl \
-H "Authorization: ApiKey your.api.key.here" \
https://your-company.your-region-code.qasphere.com/api/public/v0/project/BD/tcase?search=backend&include=customFields
```
#### Fetch all filled test cases corresponding to template test case ID '1CEPaUhuR_yNsLvcbYJhw46'
```bash
curl \
-H "Authorization: ApiKey your.api.key.here" \
https://your-company.your-region-code.qasphere.com/api/public/v0/project/BD/tcase?template_tcase_ids=1CEPaUhuR_yNsLvcbYJhw46
```
#### Fetch test cases linked to a specific requirement
```bash
curl \
-H "Authorization: ApiKey your.api.key.here" \
https://your-company.your-region-code.qasphere.com/api/public/v0/project/BD/tcase?requirementIds=1CEPaUhuR_abc123def456
```
#### Fetch test cases linked to multiple requirements (OR logic)
```bash
curl \
-H "Authorization: ApiKey your.api.key.here" \
"https://your-company.your-region-code.qasphere.com/api/public/v0/project/BD/tcase?requirementIds=1CEPaUhuR_abc123def456&requirementIds=1CEPaUhuR_xyz789ghi012"
```
### Response Fields
```typescript
{
total: number, // Total number of filtered test cases
offset?: number, // The offset that was applied (present when pagination was applied)
limit?: number, // The limit that was applied (present when pagination was applied)
page?: number, // **Deprecated**. Echo of the page that was requested (present only if `page` was used in the request)
data: Array<{ // List of test case objects
id: string // Unique identifier of the test case
legacyId: string // Legacy identifier of the test case. Empty string if the test case has no legacy ID
version: number // Version of the test case. Updates to test (except folder/pos) creates a new version
type: string // Type of the test case (`standalone` | `template` | `filled`)
title: string // Title of the test case
seq: number // Sequence number of the test case. Test cases in a project are assigned incremental sequence numbers
folderId: number // Identifier of the folder where the test case is placed
pos: number // Ordered position (0 based) of the test case in its folder
priority: string // Priority of the test case (`high` | `medium` | `low`)
comment: html // Test case precondition text. DEPRECATED, usable but prefer precondition object below
precondition: {
projectId: string, // Project id the precondition belongs to. Same as test cases'
id: number, // Id of the precondition. Not useful unless the precondition is shared
version: number, // Version of the precondition
title?: string, // Title of the precondition. Only populated for shared
type: 'standalone' | 'shared', // Type of the precondition
text: html, // Actual text contents of the precondition
isLatest: boolean, // Whether precondition's version is latest or not
createdAt: string,
updatedAt: string,
deletedAt?: string,
}
files: Array<{ // List of files attached to the test case
id: string // Unique identifier of the file
fileName: string // Name of the file
mimeType: string // Mime type of the file
size: number // Size of the file
url: string // URL of the file
}>
links: Array<{ // Additional links relevant to the test case
text: string // Title of the link
url: string // URL of the link
}>
authorId: number // Unique identifier of the user who added the test case
isDraft: boolean // Whether the test case is still in draft state
isLatestVersion: boolean // Whether this is the latest version of the test case
isEmpty: boolean // Whether the test case is empty (has no comment and steps)
templateTCaseId?: string // Corresponding template test case ID, if it is a filled test case
numFilledTCases? number // Number of corresponding filled test cases, if it is a template test case
createdAt: string // Test case creation time (ISO 8601 format)
updatedAt: string // Test case updation time (ISO 8601 format)
// Non default fields
customFields: { // Custom fields defined for the test case
[key: string]: { // Key-value pairs of custom field system names and corresponding details for the test case
value: string // Current value
isDefault: boolean // Whether default value is set by the system or selected by the user
}
}
tags: Array<{ // List of test case tags
id: number // Unique identifier of the tag
title: string // Title of the tag
}>
steps: Array<{ // List of test case steps
id: number // Unique identifier of the step
type: string // Type of the step (standalone | shared)
version: number // Version of the step (always 1 for standalone steps)
isLatest: boolean // Whether this is the latest version of the step (always true for standalone steps)
title?: string // Title of the step (only for shared steps)
subSteps?: Array<{ // List of sub steps (only for shared steps)
id: number // Unique identifier of the step
type: string // Type of the step (shared_sub_step)
version: number // Version of the step (same as parent step)
isLatest: boolean // Whether this is the latest version (same as parent step)
description: html // Details of the sub step
expected: html // Expected result from the sub step
data?: Array // Sub step test data items (see Step Test Data)
deletedAt?: string // Date the sub step was deleted on
}>
description?: html // Details of step (only for standalone steps)
expected?: html // Expected result from the step (only for standalone steps)
data?: Array // Step test data items, only for standalone steps (see Step Test Data)
deletedAt?: string // Date the step was deleted on
}>
requirements: Array<{ // Test case requirement (currently only single requirement is supported on UI)
id: string // Unique identifier of the requirement
text: string // Title of the requirement
url: string // URL of the requirement
}>
parameterValues: { // The details of corresponding filled tcases (relevant only for template tcases)
tcaseId: string // ID of the filled tcase
tcaseVersion: number // Version of the filled tcase
values: { // Values corresponding to the parameters in the template tcase for this filled tcase
[key: string]: string
}
}
folder: { // Details of the folder where the test case is placed
id: number // Unique identifier for the folder
title: string // Name of the folder
comment: html // Additional notes or description
pos: number // Position of the folder among its siblings
parentId: number // ID of the parent folder (0 for root folders)
projectId: string // ID of the project the folder belongs to
},
path: Array<{ // Path to the folder where the test cases is placed
id: number // Unique identifier for the folder
title: string // Name of the folder
comment: html // Additional notes or description
pos: number // Position of the folder among its siblings
parentId: number // ID of the parent folder (0 for root folders)
projectId: string // ID of the project the folder belongs to
}>
project: { // Details of project to which the test case belong
id: string // Unique identifier of the project
code: string // Short code of the project
title: string // Title of the project
overviewTitle: string // Title of the project overview
overviewDescription: html // Project Overview
links: { // Links relevant to the project
text: string // Title of the link
url: string // URL of the link
}
archivedAt: string // Project archival time (ISO 8601 format)
createdAt: string // Project creation time (ISO 8601 format)
updatedAt: string // Project updation time (ISO 8601 format)
}
}>
}
```
### Example Response
```json
{
"total": 4,
"offset": 1,
"limit": 2,
"data": [
{
"id": "1CJg36j1c_yFYPRcmZaoqp3",
"version": 6,
"legacyId": "",
"seq": 55,
"type": "standalone",
"folderId": 26,
"pos": 0,
"title": "User should see the content according to the \"About Us\" information",
"priority": "high",
"comment": "
",
"isLatest": true,
"createdAt": "2025-03-25T10:48:34.66935+02:00",
"updatedAt": "2025-03-25T10:48:34.66935+02:00"
},
"authorId": 1,
"files": [
{
"id": "89f7a73e-043c-4fe1-beb3-9e8d8df55f28",
"fileName": "Screencast from 24-03-25 14:27:33.webm",
"mimeType": "video/webm",
"size": 555431
}
],
"links": [],
"isDraft": false,
"isLatestVersion": true,
"isEmpty": false,
"createdAt": "2025-03-25T10:48:14.243475+02:00",
"updatedAt": "2025-03-25T10:48:14.243475+02:00"
},
{
"id": "1CJg36j28_EaAHxNiNQNNTn",
"version": 6,
"legacyId": "",
"seq": 56,
"type": "standalone",
"folderId": 26,
"pos": 1,
"title": "User should place the order successfully after entering valid data in all required fields and selecting the \"Card Payment\" payment",
"priority": "high",
"comment": "
The \"Checkout\" page is opened
There are pizzas, drinks and desserts
",
"authorId": 1,
"files": [
{
"id": "bf5fcc05-44a2-46b2-87fb-2501cfedb1f7",
"fileName": "Screenshot 2025-01-15 18:54:44.png",
"mimeType": "image/png",
"size": 89567
}
],
"links": [],
"isDraft": false,
"isLatestVersion": true,
"isEmpty": false,
"createdAt": "2025-03-25T10:48:34.66935+02:00",
"updatedAt": "2025-03-25T10:48:34.66935+02:00"
}
]
}
```
## Get Test Case
`GET /api/public/v0/project/{project_id}/tcase/{tcase_or_legacy_id}`
Get details of a single test case using its ID, sequence or legacy ID.
### Path Parameters
- `project_id`: The project identifier (can be either the project code or UUID)
- `tcase_or_legacy_id`: The test case identifier (can be one of test case UUID, sequence or legacy ID)
### Example Request
```bash
curl \
-H "Authorization: ApiKey your.api.key.here" \
https://your-company.your-region-code.qasphere.com/api/public/v0/project/BD/tcase/1
```
### Response Fields
```typescript
{
id: string // Unique identifier of the test case
legacyId: string // Legacy identifier of the test case. Empty string if the test case has no legacy ID
version: number // Version of the test case. Updates to test (except folder/pos) creates a new version
type: string // Type of the test case (`standalone` | `template` | `filled`)
title: string // Title of the test case
seq: number // Sequence number of the test case. Test cases in a project are assigned incremental sequence numbers
folderId: number // Identifier of the folder where the test case is placed
pos: number // Ordered position (0 based) of the test case in its folder
priority: string // Priority of the test case (`high` | `medium` | `low`)
comment: html // Test case precondition text. DEPRECATED, usable but prefer precondition object below
precondition: {
projectId: string, // Project id the precondition belongs to. Same as test cases'
id: number, // Id of the precondition. Not useful unless the precondition is shared
version: number, // Version of the precondition
title?: string, // Title of the precondition. Only populated for shared
type: 'standalone' | 'shared', // Type of the precondition
text: html, // Actual text contents of the precondition
isLatest: boolean, // Whether precondition's version is latest or not
createdAt: string,
updatedAt: string,
deletedAt?: string,
}
steps: Array<{ // List of test case steps
id: number // Unique identifier of the step
type: string // Type of the step (standalone | shared)
version: number // Version of the step (always 1 for standalone steps)
isLatest: boolean // Whether this is the latest version of the step (always true for standalone steps)
title?: string // Title of the step (only for shared steps)
subSteps?: Array<{ // List of sub steps (only for shared steps)
id: number // Unique identifier of the step
type: string // Type of the step (shared_sub_step)
version: number // Version of the step (same as parent step)
isLatest: boolean // Whether this is the latest version (same as parent step)
description: html // Details of the sub step
expected: html // Expected result from the sub step
data?: Array // Sub step test data items (see Step Test Data)
deletedAt?: string // Date the sub step was deleted on
}>
description?: html // Details of step (only for standalone steps)
expected?: html // Expected result from the step (only for standalone steps)
data?: Array // Step test data items, only for standalone steps (see Step Test Data)
deletedAt?: string // Date the step was deleted on
}>
tags: Array<{ // List of test case tags
id: number // Unique identifier of the tag
title: string // Title of the tag
}>
files: Array<{ // List of files attached to the test case
id: string // Unique identifier of the file
fileName: string // Name of the file
mimeType: string // Mime type of the file
size: number // Size of the file
url?: string // URL of the file (optional, not present in sample)
}>
requirements: Array<{ // Test case requirement (currently only single requirement is supported on UI)
id: string // Unique identifier of the requirement
text: string // Title of the requirement
url: string // URL of the requirement
}>
links: Array<{ // Additional links relevant to the test case
text: string // Title of the link
url: string // URL of the link
}>
customFields: { // Custom fields defined for the test case
[key: string]: { // Key-value pairs of custom field system names and corresponding details for the test case
value: string // Current value
isDefault: boolean // Whether default value is set by the system or selected by the user
}
}
parameterValues: { // The details of corresponding filled tcases (relevant only for template tcases)
tcaseId: string // ID of the filled tcase
tcaseVersion: number // Version of the filled tcase
values: { // Values corresponding to the parameters in the template tcase for this filled tcase
[key: string]: string
}
}
authorId: number // Unique identifier of the user who added the test case
isDraft: boolean // Whether the test case is still in draft state
isLatestVersion: boolean // Whether this is the latest version of the test case
isEmpty: boolean // Whether the test case is empty (has no comment and steps)
templateTCaseId?: string // Corresponding template test case ID, if it is a filled test case
numFilledTCases? number // Number of corresponding filled test cases, if it is a template test case
createdAt: string // Test case creation time (ISO 8601 format)
updatedAt: string // Test case updation time (ISO 8601 format)
}
```
### Sample Response
```json
{
"id": "1CJg36j1c_yFYPRcmZaoqp3",
"version": 6,
"legacyId": "",
"seq": 55,
"type": "standalone",
"folderId": 26,
"pos": 0,
"title": "User should see the content according to the \"About Us\" information",
"priority": "high",
"comment": "
"
}
]
}
],
"customFields": {
"automation": {
"value": "Automated",
"isDefault": false
},
"known_issue": {
"value": "No",
"isDefault": true
}
},
"isDraft": false,
"isLatestVersion": true,
"isEmpty": false,
"createdAt": "2025-03-25T10:48:14.243475+02:00",
"updatedAt": "2025-03-25T10:48:14.243475+02:00"
}
```
## Get Test Case Edit History
`GET /api/public/v0/project/{project_id}/tcase/{tcase_or_legacy_id}/history/paginated`
`/paginated` endpoints are transitional. In API v1, the base paths will return paginated responses and the `/paginated` suffix will be removed.
Retrieves the edit history of a single test case — who changed what and when. This is the same data shown in the "Edit History" panel in the web interface. Entries are returned newest first, and history is available even for deleted test cases.
### Path Parameters
- `project_id`: The project identifier (can be either the project code or UUID)
- `tcase_or_legacy_id`: The test case identifier (can be one of test case UUID, sequence or legacy ID)
### Query Parameters
| Parameter | Type | Description | Default | Example |
| ----------- | ------ | ----------------------------------------------------------------------------------------------- | --------------- | ---------------------- |
| `offset` | number | Number of rows to skip before returning results. | `0` | `offset=10` |
| `limit` | number | Maximum number of entries to return. Accepted range: 0–1,000. | `100` | `limit=20` |
| `sortField` | string | Field used to sort results: `id`, `action_type`, `author_id`, `tcase_version`, or `created_at`. | `tcase_version` | `sortField=created_at` |
| `sortOrder` | string | Sort direction: `asc` or `desc`. | `desc` | `sortOrder=asc` |
### Example Request
```bash
curl \
-H "Authorization: ApiKey your.api.key.here" \
"https://your-company.your-region-code.qasphere.com/api/public/v0/project/BD/tcase/55/history/paginated?offset=0&limit=100"
```
### Response Fields
```typescript
{
total: number, // Total number of test case edit history
offset: number, // The page offset
limit: number, // The page limit
data: Array<{ // List of test case edit history in the page
id: number // Unique identifier of the entry
actionType: string // What changed (`create` | `change_type` | `delete` | `restore` | `title` | `priority` | `precondition` | `tags` | `steps` | `publish` | `others` | `version_rollback`)
tcaseId: string // Identifier of the test case
authorId: number // Unique identifier of the user who made the change
author: { // Details of the user who made the change
id: number // Unique identifier of the user
name: string // Name of the user
email: string // Email of the user
avatar?: string // Avatar URL of the user; fetching it requires authentication
role: string // Role of the user (`owner` | `admin` | `user` | `test-runner` | `viewer`)
}
oldValue?: string // Value before the change. Populated for `title`, `priority` and `change_type` changes; contains the version number for `version_rollback`
newValue?: string // Value after the change. Populated for the same action types as oldValue
tcaseVersion: number // Version of the test case this change produced
createdAt: string // Time of the change (ISO 8601 format)
}>
}
```
### Sample Response
```json
{
"total": 2,
"offset": 0,
"limit": 100,
"data": [
{
"id": 2,
"actionType": "title",
"tcaseId": "1CJg36j1c_yFYPRcmZaoqp3",
"authorId": 1,
"author": {
"id": 1,
"email": "jane@example.com",
"name": "Jane Doe",
"avatar": null,
"role": "admin"
},
"newValue": "User can log in with valid credentials",
"oldValue": "User can log in",
"tcaseVersion": 2,
"createdAt": "2026-08-05T10:48:34.66935+02:00"
},
{
"id": 1,
"actionType": "create",
"tcaseId": "1CJg36j1c_yFYPRcmZaoqp3",
"authorId": 1,
"author": {
"id": 1,
"email": "jane@example.com",
"name": "Jane Doe",
"avatar": null,
"role": "admin"
},
"newValue": null,
"oldValue": null,
"tcaseVersion": 1,
"createdAt": "2026-08-05T10:12:14.243475+02:00"
}
]
}
```
## Get Test Case Edit History (Deprecated)
**Deprecated**
This endpoint is deprecated. Use [Get Test Case Edit History](#get-test-case-edit-history) (`GET /api/public/v0/project/{project_id}/tcase/{tcase_or_legacy_id}/history/paginated`) instead.
`GET /api/public/v0/project/{project_id}/tcase/{tcase_or_legacy_id}/history`
Retrieves the edit history of a single test case — who changed what and when. This is the same data shown in the "Edit History" panel in the web interface. Entries are returned newest first, and history is available even for deleted test cases.
### Path Parameters
- `project_id`: The project identifier (can be either the project code or UUID)
- `tcase_or_legacy_id`: The test case identifier (can be one of test case UUID, sequence or legacy ID)
### Query Parameters
All query parameters are optional.
| Parameter | Type | Description | Example |
| --------- | ------ | -------------------------------------------------------------------------------------------------------------------------------------------- | ----------- |
| `offset` | number | Number of rows to skip before returning results. Combine with `limit` for offset-based pagination. | `offset=10` |
| `limit` | number | Maximum number of entries to return (0–5000). May be `0` to return only the total count (no rows). | `limit=10` |
| `page` | number | **Deprecated** — use `offset` instead. 1-based page number. Ignored when `offset` is set. If `limit` is omitted, a default of 10 is applied. | `page=1` |
### Example Request
```bash
curl \
-H "Authorization: ApiKey your.api.key.here" \
https://your-company.your-region-code.qasphere.com/api/public/v0/project/BD/tcase/55/history
```
### Response Fields
```typescript
{
total: number // Total number of edit history entries for the test case
offset?: number // Offset applied to the query, if any
limit?: number // Limit applied to the query, if any
page?: number // Echoes the deprecated page param when it was used
data: Array<{ // Edit history entries, newest first
id: number // Unique identifier of the entry
actionType: string // What changed (`create` | `change_type` | `delete` | `restore` | `title` | `priority` | `precondition` | `tags` | `steps` | `publish` | `others` | `version_rollback`)
tcaseId: string // Identifier of the test case
authorId: number // Unique identifier of the user who made the change
author: { // Details of the user who made the change
id: number // Unique identifier of the user
name: string // Name of the user
email: string // Email of the user
avatar?: string // Avatar URL of the user; fetching it requires authentication
role: string // Role of the user (`owner` | `admin` | `user` | `test-runner` | `viewer`)
}
oldValue?: string // Value before the change. Populated for `title`, `priority` and `change_type` changes; contains the version number for `version_rollback`
newValue?: string // Value after the change. Populated for the same action types as oldValue
tcaseVersion: number // Version of the test case this change produced
createdAt: string // Time of the change (ISO 8601 format)
}>
}
```
### Sample Response
```json
{
"total": 2,
"data": [
{
"id": 2,
"actionType": "title",
"tcaseId": "1CJg36j1c_yFYPRcmZaoqp3",
"authorId": 1,
"author": {
"id": 1,
"email": "jane@example.com",
"name": "Jane Doe",
"avatar": null,
"role": "admin"
},
"newValue": "User can log in with valid credentials",
"oldValue": "User can log in",
"tcaseVersion": 2,
"createdAt": "2026-08-05T10:48:34.66935+02:00"
},
{
"id": 1,
"actionType": "create",
"tcaseId": "1CJg36j1c_yFYPRcmZaoqp3",
"authorId": 1,
"author": {
"id": 1,
"email": "jane@example.com",
"name": "Jane Doe",
"avatar": null,
"role": "admin"
},
"newValue": null,
"oldValue": null,
"tcaseVersion": 1,
"createdAt": "2026-08-05T10:12:14.243475+02:00"
}
]
}
```
## Get Test Case Count
`GET /api/public/v0/project/{project_id}/tcase/count`
Returns the total number of test cases that match the specified filters. If no filters are provided, returns the total count of all test cases in the project.
### Path Parameters
- `project_id`: The project identifier (can be either the project code or UUID)
### Query Parameters
| Parameter | Type | Description | Example |
| ------------ | ------- | ----------------------------------------------------- | ----------------------------------- |
| `folders` | number | Filter by folder IDs | `folders=1&folders=2` |
| `recursive` | boolean | Include test cases in subfolders (requires `folders`) | `recursive=true` |
| `tags` | number | Filter by tag IDs | `tags=1&tags=2` |
| `priorities` | string | Filter by priority levels (high, medium, low) | `priorities=high&priorities=medium` |
| `draft` | boolean | Filter by draft status | `draft=true` |
### Example Requests
#### Basic Count
```bash
curl \
-H "Authorization: ApiKey your.api.key.here" \
"https://your-company.your-region-code.qasphere.com/api/public/v0/project/BD/tcase/count"
```
#### Filter Examples
1. **Folder-based counting**:
```bash
curl \
-H "Authorization: ApiKey your.api.key.here" \
"https://your-company.your-region-code.qasphere.com/api/public/v0/project/BD/tcase/count?folders=1&recursive=true"
```
2. **Priority-based counting**:
```bash
curl \
-H "Authorization: ApiKey your.api.key.here" \
"https://your-company.your-region-code.qasphere.com/api/public/v0/project/BD/tcase/count?priorities=high"
```
3. **Tag-based counting**:
```bash
curl \
-H "Authorization: ApiKey your.api.key.here" \
"https://your-company.your-region-code.qasphere.com/api/public/v0/project/BD/tcase/count?tags=1&tags=2"
```
4. **Draft status counting**:
```bash
curl \
-H "Authorization: ApiKey your.api.key.here" \
"https://your-company.your-region-code.qasphere.com/api/public/v0/project/BD/tcase/count?draft=true"
```
5. **Custom field counting**:
```bash
curl \
-H "Authorization: ApiKey your.api.key.here" \
"https://your-company.your-region-code.qasphere.com/api/public/v0/project/BD/tcase/count?cf_automation=Automated"
```
### Response Format
```typescript
{
count: number // Total number of test cases matching the filters
}
```
### Example Response
```json
{
"count": 4
}
```
### Error Responses
| Status Code | Description |
| ----------- | -------------------------------------------- |
| 401 | Invalid or missing API key |
| 403 | Insufficient permissions or suspended tenant |
| 404 | Project not found |
| 400 | Invalid filter parameters |
| 500 | Internal server error |
**Use Cases**
- Monitor test coverage by counting test cases across different folders
- Track high-priority test case volume
- Review draft test case count before publishing
- Plan test runs based on tagged test cases
**Filter Behavior**
- If no filters are specified, all test cases in the project are counted
- Different filters are combined with AND logic
- Multiple values for the same filter are combined with OR logic
- The `recursive` parameter only applies when `folders` is specified
## Create Test Case
`POST /api/public/v0/project/{project_id}/tcase`
Creates a new test case in the specified project. You can create both standalone and template test cases using this endpoint.
### Path Parameters
- `project_id`: The project identifier (can be either the project code or UUID)
### Request Body
```typescript
{
title: string // Required: Test case title (must be between 1-511 characters)
type: string // Required: Type of test case (`standalone` | `template`)
folderId: number // Required: ID of the folder where the test case will be placed
priority: string // Required: Test case priority (`high` | `medium` | `low`)
pos?: number // Optional: Position within the folder (0-based index)
comment?: html // Optional: Test case precondition. DEPRECATED, if precondition object is empty, comment is used to populated precondition.text
precondition?: // Optional: Test case precondition
| { sharedPreconditionId: number } // Use a shared precondition by specifying its unique id
| { text: html } // Or, use a standalone precondition with text
steps?: Array<{ // Optional: List of test case steps
// For shared steps
sharedStepId?: number // Unique identifier of the shared step
// For standalone steps
description?: html // Details of steps
expected?: html // Expected result from the step
data?: Array // Step test data items, max 20 (see Step Test Data)
}>
tags?: string[] // Optional: List of tag titles (max 255 characters each)
requirements?: Array<{ // Optional: Test case requirement
text: string // Required: Title of the requirement (must be between 1-255 characters)
url: string // Required: URL of the requirement (must be between 1-255 characters)
}>
files?: Array<{ // Optional: Files attached to the test case
id: string // Required: File identifier, typically returned by the upload file endpoint
fileName: string // Required: Original file name
mimeType: string // Required: MIME type of the file
size: number // Required: File size in bytes
url?: string // Optional: File URL returned by the upload file endpoint
}>
links?: Array<{ // Optional: Additional links relevant to the test case
text: string // Required: Title of the link (must be between 1-255 characters)
url: string // Required: URL of the link (must be between 1-255 characters)
}>
customFields?: { // Optional: Custom field values.
[key: string]: { // Custom field system names should be specified as keys. Only custom fields applied and enabled for a project should be specified
isDefault: boolean // Whether to set the default value. Should be true only if the custom field actually has a default value
value: string // Custom field value to be set. Should be specified only if not setting to the default value
}
}
parameterValues?: Array<{ // Optional: Values to substitute for parameters in the filled test cases (only relevant for template types)
values: { // Values for the parameters in the template test case to be substituted for this filled test case
[key: string]: string
}
}>
filledTCaseTitleSuffixParams?: string[] // Optional: Parameters to append to filled test case titles
isDraft?: boolean // Whether to create as draft, default false
}
```
- **Required fields**: `type`, `folderId`, `title`, `priority`
- **Test case types**: Only `standalone` and `template` can be created directly. `filled` test cases are automatically generated from template test cases.
- **Steps**: You can use either shared steps (by `sharedStepId`) or standalone steps (with `description`, `expected`, and/or `data`).
- **Step test data**: Standalone steps can include up to 20 `data` items (see Step Test Data). A step that references a shared step by `sharedStepId` must not include `data`.
- **Custom fields**: Must be created through the web UI before you can set their values via API.
- **Template test cases**: Use `parameterValues` to define parameter substitutions that will generate filled test cases.
- **Parameter names**: The keys of `parameterValues[].values` and the entries of `filledTCaseTitleSuffixParams` must start with a letter, contain only letters, digits, hyphens and underscores, end with a letter or digit, and be at most 255 characters. Placeholders inside the title, precondition and steps are not restricted this way - a `${...}` placeholder whose name breaks these rules is kept as literal text.
- **Position**: If `pos` is not specified, the test case will be added at the end of the folder.
- **Files**: Use the upload file endpoint first. Public upload responses include `id` and `url`; when attaching files to a test case, also provide the matching `fileName`, `mimeType`, and `size`.
### Example Requests
#### Create a Simple Standalone Test Case
```bash
curl \
-H "Authorization: ApiKey your.api.key.here" \
-H "Content-Type: application/json" \
-d '{
"type": "standalone",
"folderId": 26,
"title": "User should be able to login with valid credentials",
"priority": "high",
"precondition": {
"text": "
"
}
]
}' \
https://your-company.your-region-code.qasphere.com/api/public/v0/project/BD/tcase
```
### Response Fields
```typescript
{
id: string // Unique identifier of the created test case
seq: number // Sequence number of the test case in the project
}
```
### Example Response
Status: 201 Created
```json
{
"id": "1CJg36j1c_yFYPRcmZaoqp3",
"seq": 57
}
```
### Error Responses
| Status Code | Description |
| ----------- | ---------------------------------------------- |
| 400 | Invalid request data or validation errors |
| 401 | Invalid or missing API key |
| 403 | Insufficient permissions or suspended tenant |
| 404 | Project or folder not found |
| 409 | Position conflict or duplicate requirement |
| 500 | Internal server error while creating test case |
**Template Test Cases**
- Template test cases use `${parameter}` syntax in titles, comments, and steps
- Parameter values are substituted when creating filled test cases
- Multiple parameter value sets create multiple filled test cases
- Filled test cases inherit all properties from their template parent
- Updates to template test cases automatically update corresponding filled test cases
## Update Test Case
`PATCH /api/public/v0/project/{project_id}/tcase/{tcase_or_legacy_id}`
Updates a test case using its ID, sequence or legacy ID. Only users with role User or higher are allowed to update test cases.
### Path Parameters
- `project_id`: The project identifier (can be either the project code or UUID)
- `tcase_or_legacy_id`: The test case identifier (can be one of test case UUID, sequence or legacy ID)
### Request Body
```typescript
{
title?: string // Optional: Test case title (must be between 1-511 characters)
priority?: string // Optional: Test case priority (`high` | `medium` | `low`)
comment?: html // Optional: Test case precondition. DEPRECATED, if precondition object is not present but comment is, value of comment will be used to populated precondition.text
precondition?: // Optional: Test case precondition
| { sharedPreconditionId: number } // Use a shared precondition by specifying its unique id
| { text: html } // Or, use a standalone precondition with text
isDraft?: boolean // Optional: To publish a draft test case. A published test case cannot be converted to draft
steps?: Array<{ // Optional: List of test case steps
// For shared steps
sharedStepId?: number // Unique identifier of the shared step
// For standalone steps
description?: html // Details of steps
expected?: html // Expected result from the step
data?: Array // Step test data items, max 20 (see Step Test Data)
}>
tags?: string[] // Optional: List of test case tags (title)
requirements?: Array<{ // Optional: Test case requirement
text: string // Title of the requirement (must be between 1-255 characters)
url: string // URL of the requirement (must be between 1-255 characters)
}>
files?: Array<{ // Optional: Files attached to the test case
id: string // File identifier, typically returned by the upload file endpoint
fileName: string // Original file name
mimeType: string // MIME type of the file
size: number // File size in bytes
url?: string // File URL returned by the upload file endpoint
}>
links?: Array<{ // Optional: Additional links relevant to the test case
text: string // Title of the link (must be between 1-255 characters)
url: string // URL of the link (must be between 1-255 characters)
}>
customFields?: { // Optional: Custom field values to update. Only specified custom fields are updated, others are left as is
[key: string]: { // Custom field system names should be specified as keys. Only custom fields applied and enabled for a project should be specified
isDefault: boolean // Whether to set the default value. Should be true only if the custom field actually has a default value
value: string // Custom field value to be set. Should be specified only if not setting to the default value
}
}
parameterValues?: Array<{ // Optional: Values to substitute for parameters in the filled test cases (only relevant for template types)
tcaseId: string // Should be specified in order to update existing filled test case. Otherwise a new filled test case would be created. If an existing filled test case is absent in the update request, it is deleted
values: { // Values for the parameters in the template test case to be substituted for this filled test case
[key: string]: string
}
}>
}
```
- All top-level fields are optional. Include only the top-level fields that need to be updated in the request.
- For `customFields`, only the specified `key` values are updated; others remain unchanged.
- Steps can be either `shared` or `standalone`. To use a shared step, specify `sharedStepId`. For standalone steps, specify `description`, `expected`, and/or `data`.
- Standalone steps can include up to 20 `data` items (see Step Test Data). If you update `steps`, send the complete step list including each step's `data` — sending a step with an empty or omitted `data` list removes all its test data, and a step whose only content was `data` is dropped from the test case entirely. A step that references a shared step by `sharedStepId` must not include `data`.
- Filled test case type cannot be updated.
- If you update `files`, send the complete list of files you want stored on the test case.
- The keys of `parameterValues[].values` and the entries of `filledTCaseTitleSuffixParams` must follow the parameter name rules described under the create endpoint.
### Example Request
#### Switch to a Shared Precondition, Updating Test Case Title, Priority And Custom Field Value
```bash
curl \
-H "Authorization: ApiKey your.api.key.here" \
-H "Content-Type: application/json" \
-d '{
"title": "Changing to corresponding cursor after hovering the element",
"precondition": {
"id": 42
},
"priority": "high",
"customFields": {
"automation": {
"isDefault": false,
"value": "Automated"
}
}
}' \
https://your-company.your-region-code.qasphere.com/api/public/v0/project/BD/tcase/1
```
#### Updating Multiple Custom Fields Values
```bash
curl \
-H "Authorization: ApiKey your.api.key.here" \
-H "Content-Type: application/json" \
-d '{
"customFields": {
"automation": {
"isDefault": false,
"value": "Cannot be Automated"
},
"known_issue": {
"isDefault": true
}
}
}' \
https://your-company.your-region-code.qasphere.com/api/public/v0/project/BD/tcase/56
```
- Custom fields and shared steps must be created through the web UI before you can set their values via API
- Use the system name (lowercase with underscores) of the custom field, not its display name
- The field value must match one of the predefined options for the custom field
- When updating custom fields, only the fields you specify will be modified
- To remove a custom field value, you need to set it to an empty string (if allowed by the field configuration)
### Example Response
Status: 200 OK
```json
{
"message": "Test case updated"
}
```
### Error Responses
| Status Code | Description |
| ----------- | ---------------------------------------------- |
| 400 | Converting a published test case to draft |
| 401 | Invalid or missing API key |
| 403 | Insufficient permissions or suspended tenant |
| 404 | Project or test case not found |
| 500 | Internal server error while updating test case |
---
# Custom Fields
URL: /docs/api/tcases_custom_fields
Custom fields allow you to extend test cases with additional metadata specific to your organization's needs. You can use custom fields to track information like automation status, test environment, component ownership, or any other project-specific attributes.
## Types of Custom Fields
In QA Sphere, there are four types of custom fields:
1. **Text**: A plain string value.
2. **Rich Text**: Text supporting formatting, held as HTML (see [HTML Support](https://qasphere.com/docs/api/html-support)).
3. **Dropdown**: One value out of the field's list of options.
4. **Checkbox**: A boolean.
- **Single option checkbox**: the option holds the label of the checked value, and an unchecked field holds an empty value.
- **Two option checkbox**: option order is significant, the first option holds the label of the checked value and the second one that of the unchecked value. The field always holds one of the two.
Every custom field has a display `name` and a `systemName`. The display name can be changed at any time, the system name cannot.
Keep system names short and readable, such as `automation` or `test_environment`, since they appear in test case payloads and filters and cannot be changed later.
A field can be marked `required` and can carry a `defaultValue`, which is applied to test cases that do not provide a value of their own. A required field always has a default value. For a checkbox, both follow from its options instead of being configurable:
- **Single option checkbox**: never required and has no default value.
- **Two option checkbox**: always required, with its unchecked value as the default value.
Only fields with `enabled: true` are meant to be used, and a field applies either to all projects (`allowAllProjects: true`) or only to the projects listed in `allowedProjectIds`.
## Using Custom Fields in Test Cases
Custom fields can be used when creating or updating test cases. Values are keyed by the field's `systemName`, not by its `id`.
### Creating Test Cases with Custom Fields
When creating a test case, you can include custom field values using the `customFields` object:
```json
{
"type": "standalone",
"folderId": 1,
"title": "Login Test",
"priority": "high",
"customFields": {
"automation": {
"value": "Automated"
},
"test_environment": {
"value": "production"
},
"regression": {
"value": "Yes"
},
"notes": {
"value": "
Covers the happy path only.
"
}
}
}
```
### Custom Field Value Structure
Each custom field value in the `customFields` object should have:
- `value`: The actual value for the field. For dropdown and checkbox fields it must match one of the option `value` strings from the field's `options` array. An empty value is accepted only by a field that is not required, which is why a single option checkbox always takes one and a two option checkbox never does. Richtext values are HTML and are sanitized server-side
- `isDefault`: Boolean indicating whether to use the field's default value. When `true`, `value` must either be left out or match the field's default value, and the field must have a default value at all
### Using Default Values
You can use the default value for a custom field by setting `isDefault: true`, leaving out `value` or setting it to the field's default value:
```json
{
"customFields": {
"automation": {
"isDefault": true
}
}
}
```
The flag ties the test case value to the field definition. Whenever the field's `defaultValue` changes afterwards, the new default is applied to every test case value carrying `isDefault: true` and to every test case that has no value for the field, while clearing the field's default value removes those values again.
Default values are also applied without the flag:
- In a create request, a field left out of `customFields` takes the field's default value, if it has one, and is marked with `isDefault: true`. A required field does the same when an empty value is passed, while for a field that is not required an empty value is stored as an empty value.
- In an update request, only the fields present in `customFields` are changed and no default value is filled in. A required field can therefore not be given an empty value, unless `isDefault` is set.
### Filtering Test Cases by Custom Fields
Custom fields can also be used to filter test cases when listing them. Use the format `cf_{systemName}=value` in query parameters:
```bash
curl \
-H "Authorization: ApiKey your.api.key.here" \
"https://your-company.your-region-code.qasphere.com/api/public/v0/project/BD/tcase?cf_automation=Automated"
```
Multiple values for the same custom field can be specified:
```bash
curl \
-H "Authorization: ApiKey your.api.key.here" \
"https://your-company.your-region-code.qasphere.com/api/public/v0/project/BD/tcase?cf_automation=Automated&cf_automation=In%20Progress"
```
## List Project Custom Fields
`GET /api/public/v0/project/{project_id}/custom-field`
Returns all custom fields available for the project. This endpoint is useful when creating or updating test cases that include custom field values.
### Path Parameters
- `project_id`: The project identifier (can be either the project code or UUID)
### Response
Status: 200 OK
```typescript
{
customFields: Array<{
id: string // Unique custom field identifier
type: 'text' | 'dropdown' | 'checkbox' | 'richtext' // Field type
systemName: string // System identifier for the field (used in API requests)
name: string // Display name of the field
required: boolean // Whether the field is required for test cases
enabled: boolean // Whether the field is currently enabled
options?: Array<{
// Available options, only for dropdown and checkbox fields
id: string // Option identifier
value: string // Option display value
}>
defaultValue?: string // Default value for the field, implied by the options for checkbox fields
pos: number // Display position/order
allowAllProjects: boolean // Whether the field is available to all projects
allowedProjectIds?: string[] // List of project IDs if not available to all projects
createdAt: string // ISO 8601 timestamp when the field was created
updatedAt: string // ISO 8601 timestamp when the field was last updated
}>
}
```
### Example Request
```bash
curl \
-H "Authorization: ApiKey your.api.key.here" \
https://your-company.your-region-code.qasphere.com/api/public/v0/project/BD/custom-field
```
### Example Response
```json
{
"customFields": [
{
"id": "1customfield_1111111111111",
"type": "dropdown",
"systemName": "automation",
"name": "Automation",
"required": false,
"enabled": true,
"options": [
{
"id": "1customfieldoption_1111111111111",
"value": "Planned"
},
{
"id": "1customfieldoption_1111111111112",
"value": "Cannot be Automated"
},
{
"id": "1customfieldoption_1111111111113",
"value": "In Progress"
},
{
"id": "1customfieldoption_1111111111114",
"value": "Automated"
},
{
"id": "1customfieldoption_1111111111115",
"value": "Broken"
}
],
"defaultValue": "Planned",
"pos": 0,
"allowAllProjects": true,
"allowedProjectIds": [],
"createdAt": "2024-01-15T10:30:00Z",
"updatedAt": "2024-01-15T10:30:00Z"
},
{
"id": "1customfield_1111111111112",
"type": "text",
"systemName": "test_environment",
"name": "Test Environment",
"required": true,
"enabled": true,
"options": [],
"defaultValue": "staging",
"pos": 1,
"allowAllProjects": false,
"allowedProjectIds": ["1project_1111111111111"],
"createdAt": "2024-01-20T14:15:00Z",
"updatedAt": "2024-01-20T14:15:00Z"
},
{
"id": "1customfield_1111111111113",
"type": "checkbox",
"systemName": "regression",
"name": "Regression",
"required": true,
"enabled": true,
"options": [
{
"id": "1customfieldoption_1111111111116",
"value": "Yes"
},
{
"id": "1customfieldoption_1111111111117",
"value": "No"
}
],
"defaultValue": "No",
"pos": 2,
"allowAllProjects": true,
"allowedProjectIds": [],
"createdAt": "2024-02-01T09:00:00Z",
"updatedAt": "2024-02-01T09:00:00Z"
},
{
"id": "1customfield_1111111111114",
"type": "richtext",
"systemName": "notes",
"name": "Notes",
"required": false,
"enabled": true,
"options": [],
"pos": 3,
"allowAllProjects": true,
"allowedProjectIds": [],
"createdAt": "2024-02-05T11:45:00Z",
"updatedAt": "2024-02-05T11:45:00Z"
}
]
}
```
### Error Responses
| Status Code | Description |
| ----------- | -------------------------------------------- |
| 401 | Invalid or missing API key |
| 403 | Insufficient permissions or suspended tenant |
| 404 | Project not found |
| 500 | Internal server error |
## Related Resources
- [Test Cases](https://qasphere.com/docs/api/tcases) - Create and manage test cases with custom fields
- [Authentication](https://qasphere.com/docs/api/authentication) - Learn about API authentication
---
# Upload Files
URL: /docs/api/upload_file
The upload file endpoints allow you to upload files to QA Sphere.
Uploaded files can be referenced in the `files` field of public test case create/update requests and inside HTML fields. Public result endpoints currently support links only and do not accept file attachments.
## Upload File
`POST /api/public/v0/file`
Upload a file to QA Sphere.
### Request Body
Request body should be a `multipart/form-data` with a `file` form-field.
### Limits
- Maximum file size: `50 MiB`
### Response Fields
| Field | Type | Description |
| ----------- | -------- | -------------------------------------------------------------------------------- |
| `id` | `string` | Unique identifier for the uploaded file |
| `stableUrl` | `string` | Host-relative URL of the uploaded file; safe across subdomain changes (use this) |
| `url` | `string` | Absolute URL of the uploaded file |
### Example Request
```bash
curl \
-H "Authorization: ApiKey your.api.key.here" \
-F 'file=@"/path/to/file"' \
https://your-company.your-region-code.qasphere.com/api/public/v0/file
```
### Example Response
```json
{
"id": "1CJLabPkq_PWeS4siaKcB1k",
"stableUrl": "/api/file/1CJLabPkq_PWeS4siaKcB1k",
"url": "https://your-company.your-region-code.qasphere.com/api/file/1CJLabPkq_PWeS4siaKcB1k"
}
```
### Error Responses
| Status Code | Description |
| ----------- | -------------------------------------------- |
| 400 | Invalid multipart request or missing `file` |
| 401 | Invalid or missing API key |
| 403 | Insufficient permissions or suspended tenant |
| 413 | File exceeds the `50 MiB` limit |
| 500 | Internal server error while uploading file |
## Upload Files In Batch
`POST /api/public/v0/file/batch`
Upload multiple files to QA Sphere in a single request.
### Request Body
Request body should be a `multipart/form-data` with one or more `files` form-fields.
### Limits
- Maximum files per request: `100`
- Maximum file size: `50 MiB` per file
- Maximum request body size: `500 MiB`
### Response Fields
```typescript
{
files: Array<{
id: string // Unique identifier for the uploaded file
stableUrl: string // Host-relative URL; safe across subdomain changes (use this)
url: string // Absolute URL
}>
}
```
### Example Request
```bash
curl \
-H "Authorization: ApiKey your.api.key.here" \
-F 'files=@"/path/to/file1"' \
-F 'files=@"/path/to/file2"' \
https://your-company.your-region-code.qasphere.com/api/public/v0/file/batch
```
### Example Response
```json
{
"files": [
{
"id": "1CJLabPkq_PWeS4siaKcB1k",
"stableUrl": "/api/file/1CJLabPkq_PWeS4siaKcB1k",
"url": "https://your-company.your-region-code.qasphere.com/api/file/1CJLabPkq_PWeS4siaKcB1k"
},
{
"id": "1CJLabPkq_Q2x7A7Lwu7GsL5",
"stableUrl": "/api/file/1CJLabPkq_Q2x7A7Lwu7GsL5",
"url": "https://your-company.your-region-code.qasphere.com/api/file/1CJLabPkq_Q2x7A7Lwu7GsL5"
}
]
}
```
### Error Responses
| Status Code | Description |
| ----------- | --------------------------------------------------------------- |
| 400 | Invalid multipart request, no files provided, or too many files |
| 401 | Invalid or missing API key |
| 403 | Insufficient permissions or suspended tenant |
| 413 | A file exceeds `50 MiB` or request body exceeds `500 MiB` |
| 500 | Internal server error while uploading files |
:::tip Use `stableUrl`
Prefer the `stableUrl` field when referencing an uploaded file. It is host-relative (e.g. `/api/file/{id}`) and keeps resolving even after your tenant's subdomain changes. URLs that embed the old subdomain stop working once the subdomain changes.
:::
:::note Relative file URLs in responses
Read endpoints (e.g. `GET /tcase/{id}`, `GET /run/{id}`) return file references **embedded in HTML fields**, such as `precondition.text`, `steps[].description`, `steps[].expected`, run/plan descriptions, and comments, as host-relative URLs (`/api/file/{id}`). To fetch such an attachment, prepend your tenant base URL (e.g. `https://your-company.your-region-code.qasphere.com`). The dedicated `files[].url` field on the test-case response remains absolute.
:::
---
# Users
URL: /docs/api/users
The users endpoint allows administrators to retrieve information about all users in the system.
## List Users
`GET /api/public/v0/users`
Returns a list of all users in the system. This endpoint is restricted to administrators only.
### Authentication
Requires an API key with Admin role permissions. See [Authentication](https://qasphere.com/docs/api/authentication) for more details.
### Response Format
```typescript
{
users: Array<{
email: string // User's email address
name: string // User's display name
role: string // User's role ('owner' | 'admin' | 'user' | 'test-runner' | 'viewer')
authorizationTypes: Array<'password' | 'google'> // Authentication methods
totpEnabled: boolean // Two-factor authentication status
createdAt: string // ISO 8601 timestamp
lastActivity: string // ISO 8601 date
}>
}
```
### User Roles
| Role | Permissions |
| --------------- | ----------------------------------------- |
| **Owner** | Full system access with tenant management |
| **Admin** | Full project access with user management |
| **User** | Can create and manage test cases and runs |
| **Test Runner** | Can execute test runs only |
| **Viewer** | Read-only access to projects |
### Example Request
```bash
curl \
-H "Authorization: ApiKey your.api.key.here" \
https://your-company.your-region-code.qasphere.com/api/public/v0/users
```
### Example Response
```json
{
"users": [
{
"email": "admin@example.com",
"name": "System Admin",
"role": "admin",
"authorizationTypes": ["password"],
"totpEnabled": true,
"createdAt": "2024-01-01T00:00:00Z",
"lastActivity": "2024-11-14"
},
{
"email": "tester@example.com",
"name": "Test Engineer",
"role": "test-runner",
"authorizationTypes": ["password", "google"],
"totpEnabled": false,
"createdAt": "2024-03-15T00:00:00Z",
"lastActivity": "2024-11-14"
}
]
}
```
### Error Responses
| Status Code | Description |
| ----------- | ------------------------------------------- |
| 401 | Invalid or missing API key |
| 403 | Insufficient permissions (non-admin access) |
| 500 | Internal server error |
### Important Notes
| Requirement | Description |
| ----------- | -------------------------------------------------- |
| Email | Must be valid and unique within the system |
| User names | Must be between 1 and 255 characters |
| Dates | Creation and activity dates are in ISO 8601 format |
| Access | Only administrators can access this endpoint |
This endpoint enables you to:
- Audit user access and roles
- Monitor user activity
- Verify authentication methods
- Check 2FA adoption
## Get Current User
`GET /api/public/v0/users/me`
Returns the user identity associated with the calling credential — the API key creator, or the user who consented to an OAuth authorization. Available to any authenticated role.
### Authentication
Requires either an API key or an OAuth Bearer token. See [Authentication](https://qasphere.com/docs/api/authentication) for more details.
### Response Format
```typescript
{
user: {
id: number // User's numeric ID
email: string // User's email address
name: string // User's display name
avatar: string | null // Avatar URL, if set; fetching it requires authentication
role: 'owner' | 'admin' | 'user' | 'test-runner' | 'viewer'
}
}
```
### Example Request (API Key)
```bash
curl \
-H "Authorization: ApiKey your.api.key.here" \
https://your-company.your-region-code.qasphere.com/api/public/v0/users/me
```
### Example Request (OAuth Bearer)
```bash
curl \
-H "Authorization: Bearer your-oauth-access-token" \
https://your-company.your-region-code.qasphere.com/api/public/v0/users/me
```
### Example Response
```json
{
"user": {
"id": 42,
"email": "you@example.com",
"name": "Your Name",
"avatar": null,
"role": "admin"
}
}
```
### Error Responses
| Status Code | Description |
| ----------- | ----------------------------- |
| 401 | Invalid or missing credential |
| 500 | Internal server error |
---
# HTML Support
URL: /docs/api/html-support
QA Sphere provides rich text formatting capabilities for certain fields in the API through HTML support. The API automatically sanitizes HTML content in requests to ensure security while preserving formatting capabilities. This sanitization process:
- **Allows** a carefully curated subset of HTML elements and attributes
- **Removes** any unsupported HTML tags, attributes, JavaScript, and other potentially malicious content
- **Preserves** safe formatting and structure for rich text content
## Supported HTML Elements
The following HTML elements are supported and will be preserved during sanitization:
### Text Formatting
- `` - Bold text
- `` - Italic text
- `` - Underlined text
- `` - Strikethrough text
- `` - Inline code formatting
### Headings
- `
` through `
` - All heading levels
### Structure and Layout
- `
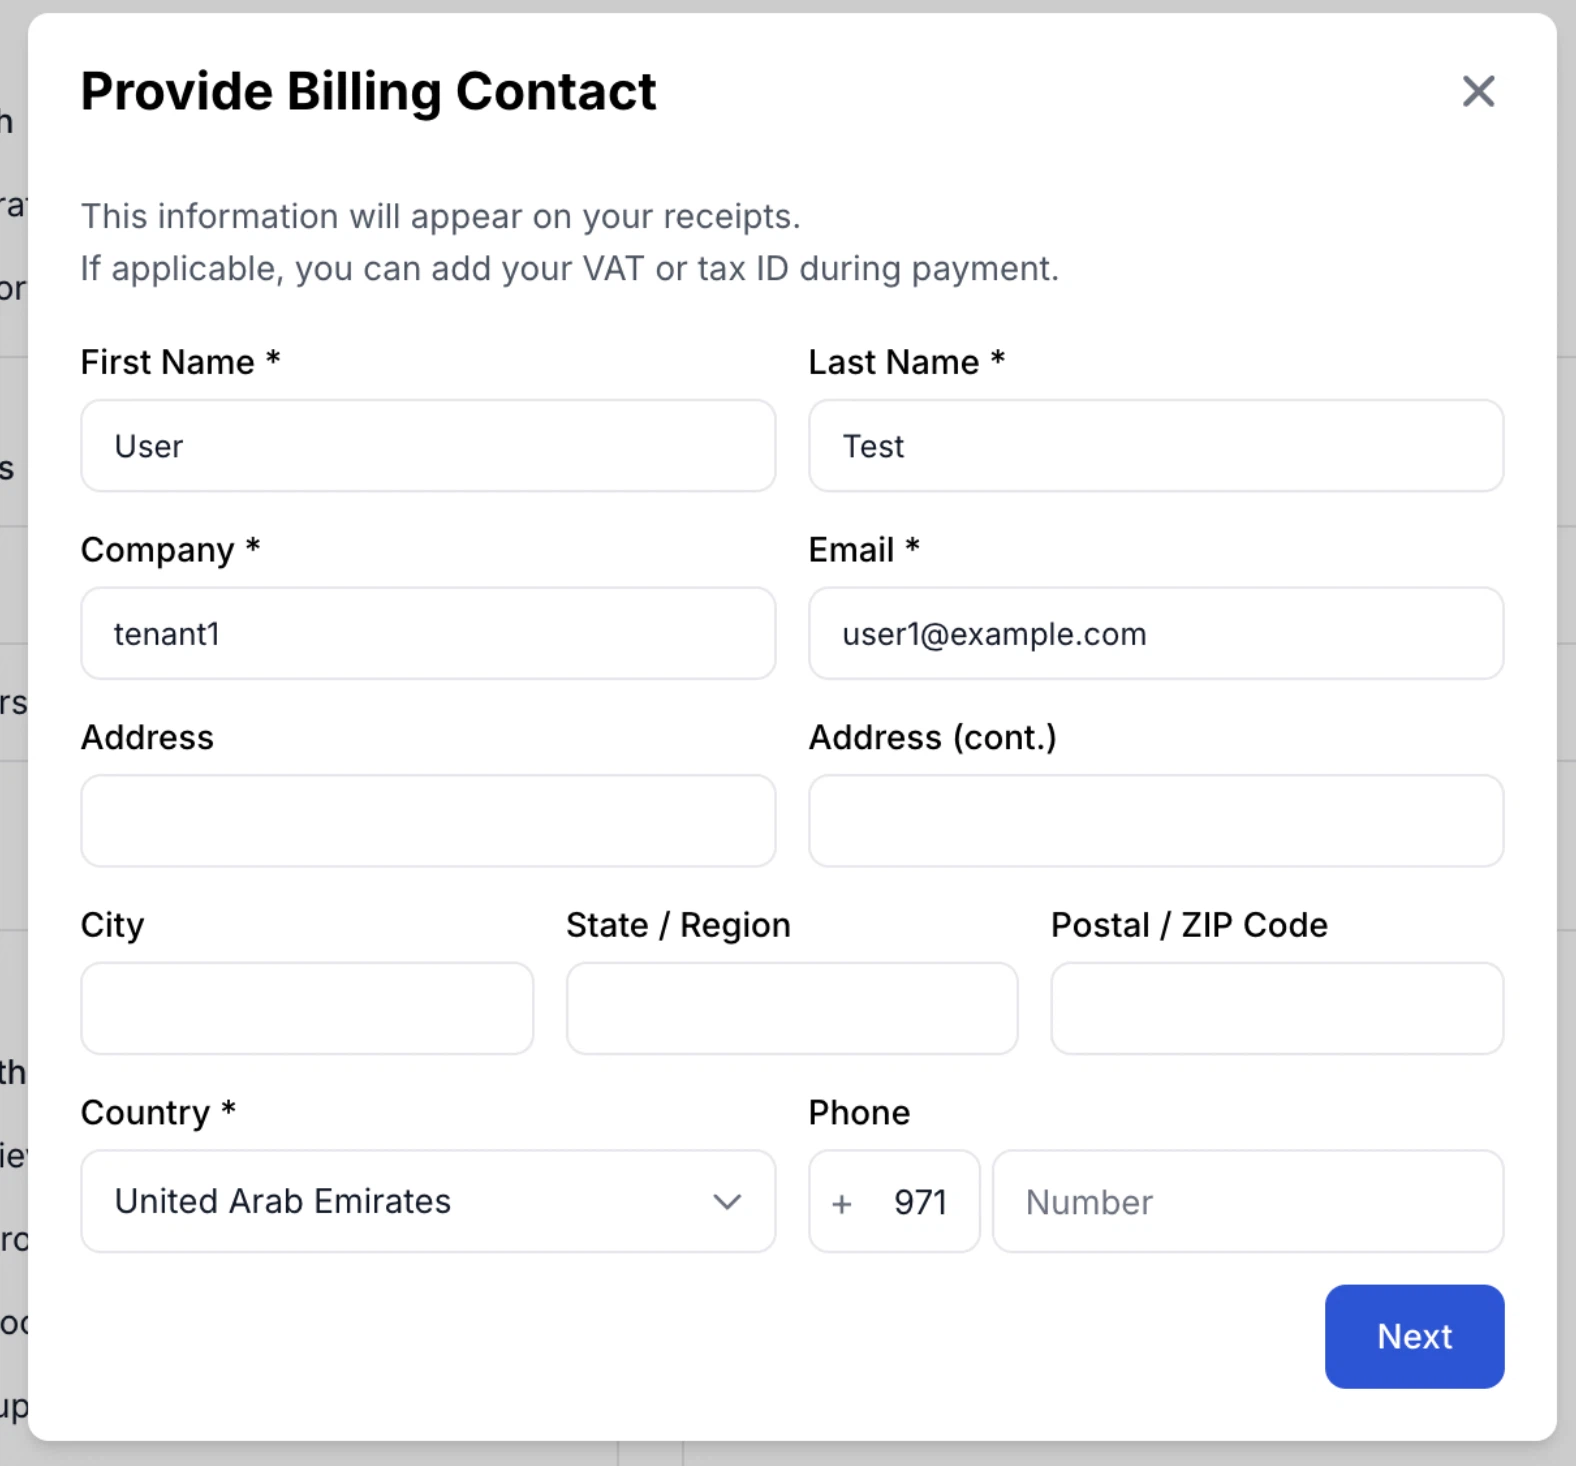 ### Viewers Do Not Consume Seats
On paid plans, **Viewer** accounts are unlimited and free. Product managers, developers, and other stakeholders who only need to follow quality status can be added without affecting your bill. Only roles above Viewer count toward the per-user price.
On free accounts the paid-seat and viewer distinction does not apply; the overall user limit governs instead.
See [Users and Permissions](https://qasphere.com/docs/users-permissions) for what each role can do.
## Choosing the Right Plan
When selecting a plan, consider the following factors:
1. **Team Size**: How many active users will need access to QA Sphere? Remember that viewers are unlimited and free.
2. **Project Complexity**: Do you manage multiple projects or have complex testing requirements?
3. **Storage Needs**: How much documentation and test artifact storage do you require?
4. **AI Usage**: How heavily will you use AI generation and the AI assistant? See [AI Features](/docs/tms/ai-features) for what consumes credits.
5. **Security Requirements**: Do you need SAML SSO, SCIM provisioning, 2FA enforcement, or an IP allow list? Those are Business-tier features.
6. **Support Level**: What level of support does your team need to operate efficiently?
Remember, you can start with the Free tier to explore QA Sphere's capabilities and upgrade as your needs grow. Our flexible structure ensures that you're never locked into a plan that doesn't serve your current needs.
---
# Security
URL: /docs/administration/security
Workspace-wide security is configured in **Settings → Security**. This page covers the controls available there and how they interact. Configuring them requires the **Admin** or **Owner** role.
## Sign-In Methods
QA Sphere supports several ways in, and you choose which are enabled for your workspace:
| Method | Availability | Notes |
| --- | --- | --- |
| **Password** | All plans | Email and password, with optional two-factor authentication |
| **Google Sign-In** | All paid plans | Can be restricted to approved email domains |
| **SAML 2.0 SSO** | Business plan and above | Okta, Microsoft Entra ID, Auth0, Google Workspace, JumpCloud, and others — see [SAML SSO](/docs/saml) |
At least one sign-in method must remain enabled at all times. Disabling a method signs out every user who has no remaining allowed method, so check who depends on a method before turning it off.
To make SSO the only way in, turn off both **Password Authentication** and **Sign in with Google** once SAML is verified.
### Restricting Google Sign-In to Your Domains
Google Sign-In accepts any Google account by default. Add an allowlist of approved email domains to limit it to accounts you control, so a personal Gmail address cannot be used to reach an invited seat. The allowlist is part of the Google Sign-In configuration, so it is available wherever Google Sign-In is.
### Viewers Do Not Consume Seats
On paid plans, **Viewer** accounts are unlimited and free. Product managers, developers, and other stakeholders who only need to follow quality status can be added without affecting your bill. Only roles above Viewer count toward the per-user price.
On free accounts the paid-seat and viewer distinction does not apply; the overall user limit governs instead.
See [Users and Permissions](https://qasphere.com/docs/users-permissions) for what each role can do.
## Choosing the Right Plan
When selecting a plan, consider the following factors:
1. **Team Size**: How many active users will need access to QA Sphere? Remember that viewers are unlimited and free.
2. **Project Complexity**: Do you manage multiple projects or have complex testing requirements?
3. **Storage Needs**: How much documentation and test artifact storage do you require?
4. **AI Usage**: How heavily will you use AI generation and the AI assistant? See [AI Features](/docs/tms/ai-features) for what consumes credits.
5. **Security Requirements**: Do you need SAML SSO, SCIM provisioning, 2FA enforcement, or an IP allow list? Those are Business-tier features.
6. **Support Level**: What level of support does your team need to operate efficiently?
Remember, you can start with the Free tier to explore QA Sphere's capabilities and upgrade as your needs grow. Our flexible structure ensures that you're never locked into a plan that doesn't serve your current needs.
---
# Security
URL: /docs/administration/security
Workspace-wide security is configured in **Settings → Security**. This page covers the controls available there and how they interact. Configuring them requires the **Admin** or **Owner** role.
## Sign-In Methods
QA Sphere supports several ways in, and you choose which are enabled for your workspace:
| Method | Availability | Notes |
| --- | --- | --- |
| **Password** | All plans | Email and password, with optional two-factor authentication |
| **Google Sign-In** | All paid plans | Can be restricted to approved email domains |
| **SAML 2.0 SSO** | Business plan and above | Okta, Microsoft Entra ID, Auth0, Google Workspace, JumpCloud, and others — see [SAML SSO](/docs/saml) |
At least one sign-in method must remain enabled at all times. Disabling a method signs out every user who has no remaining allowed method, so check who depends on a method before turning it off.
To make SSO the only way in, turn off both **Password Authentication** and **Sign in with Google** once SAML is verified.
### Restricting Google Sign-In to Your Domains
Google Sign-In accepts any Google account by default. Add an allowlist of approved email domains to limit it to accounts you control, so a personal Gmail address cannot be used to reach an invited seat. The allowlist is part of the Google Sign-In configuration, so it is available wherever Google Sign-In is.
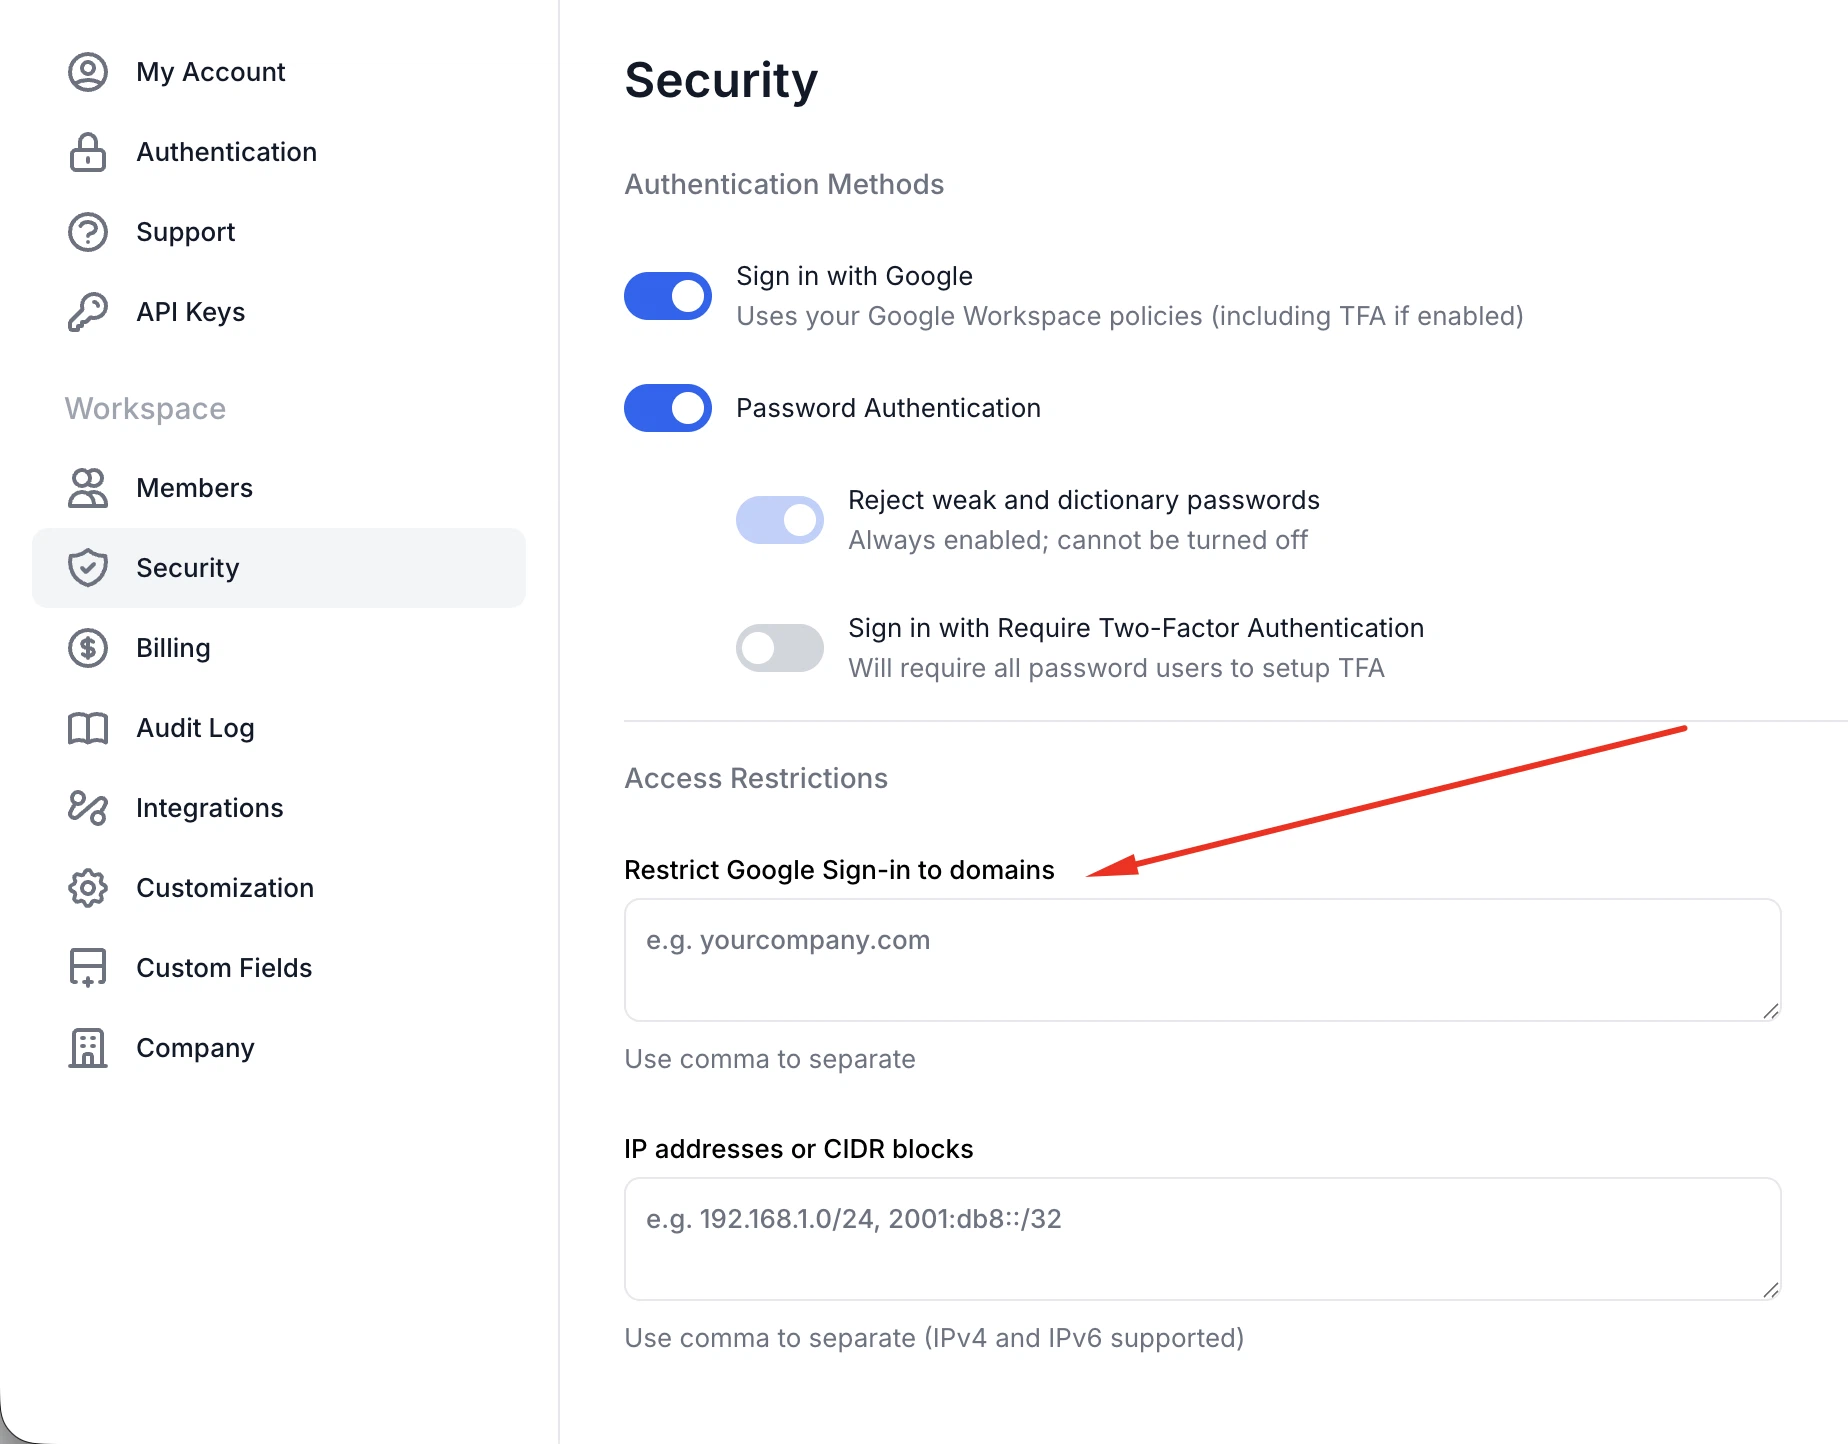 If your organization uses several verified domains, list all of them. Users whose Google account falls outside the allowlist are rejected at sign-in.
## Two-Factor Authentication
Two-factor authentication is available on **every plan**, and any user can enable it for their own account from their profile.
### Enforcing 2FA Workspace-Wide
On the **Business plan**, admins can require 2FA for everyone in the workspace. When you enable enforcement:
- Users who already have 2FA configured are unaffected.
- Users without 2FA are signed out and must complete 2FA setup on their next sign-in.
If your organization uses several verified domains, list all of them. Users whose Google account falls outside the allowlist are rejected at sign-in.
## Two-Factor Authentication
Two-factor authentication is available on **every plan**, and any user can enable it for their own account from their profile.
### Enforcing 2FA Workspace-Wide
On the **Business plan**, admins can require 2FA for everyone in the workspace. When you enable enforcement:
- Users who already have 2FA configured are unaffected.
- Users without 2FA are signed out and must complete 2FA setup on their next sign-in.
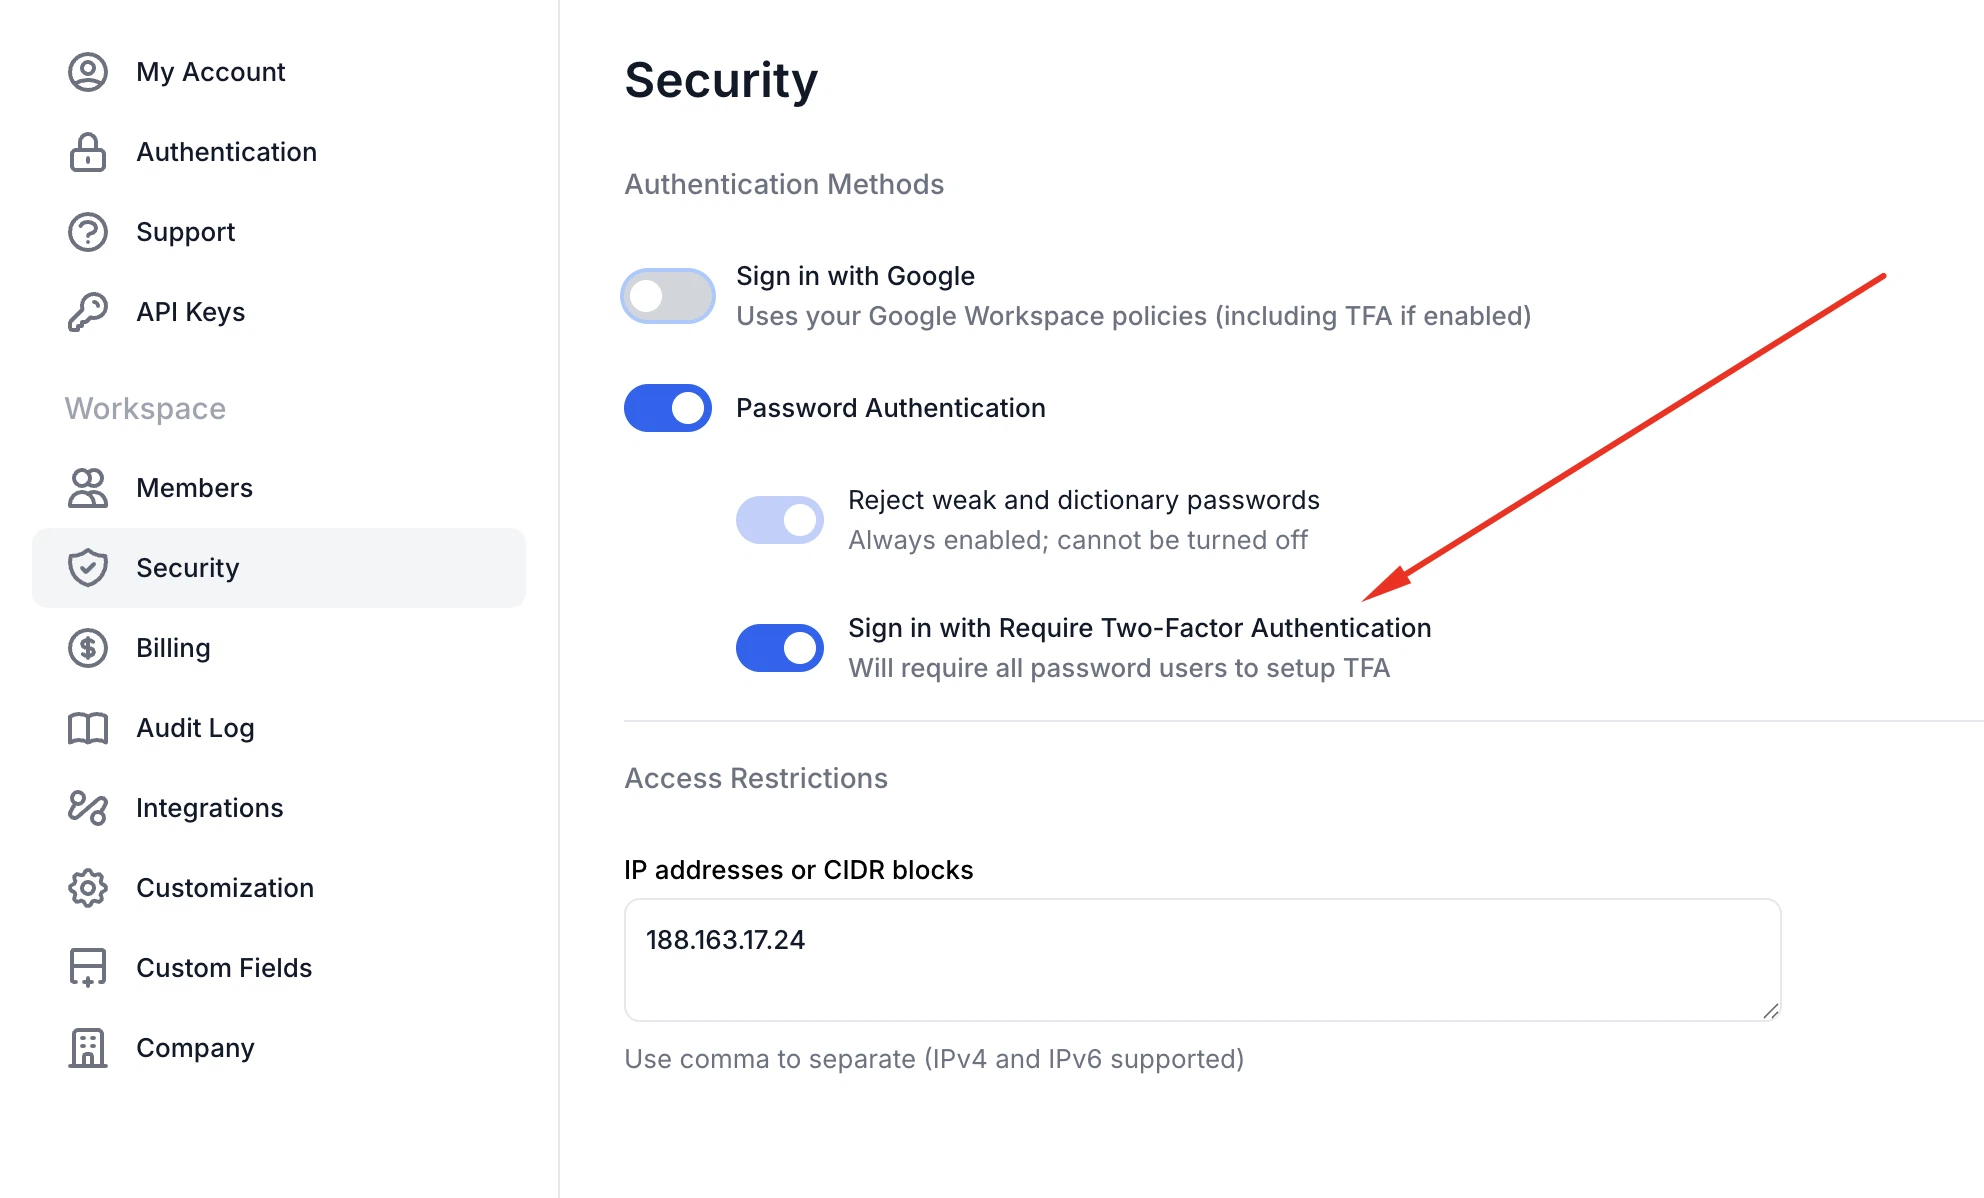 Enforcement signs out every user who has not yet set up 2FA. Announce it before you enable it, or you will field a wave of confused messages from people who cannot get back in.
The 2FA status of each member is visible and sortable in **Settings → Members**, which is the quickest way to see who still needs to enrol before you enforce.
2FA applies to password sign-ins. For SAML sign-ins, multi-factor authentication is your identity provider's responsibility — QA Sphere does not run its own challenge on top of a SAML assertion.
## IP Allow List
On the **Business plan**, workspace access can be restricted to a list of approved IP addresses or CIDR ranges — useful when access should only be possible from an office network or a corporate VPN.
Enforcement signs out every user who has not yet set up 2FA. Announce it before you enable it, or you will field a wave of confused messages from people who cannot get back in.
The 2FA status of each member is visible and sortable in **Settings → Members**, which is the quickest way to see who still needs to enrol before you enforce.
2FA applies to password sign-ins. For SAML sign-ins, multi-factor authentication is your identity provider's responsibility — QA Sphere does not run its own challenge on top of a SAML assertion.
## IP Allow List
On the **Business plan**, workspace access can be restricted to a list of approved IP addresses or CIDR ranges — useful when access should only be possible from an office network or a corporate VPN.
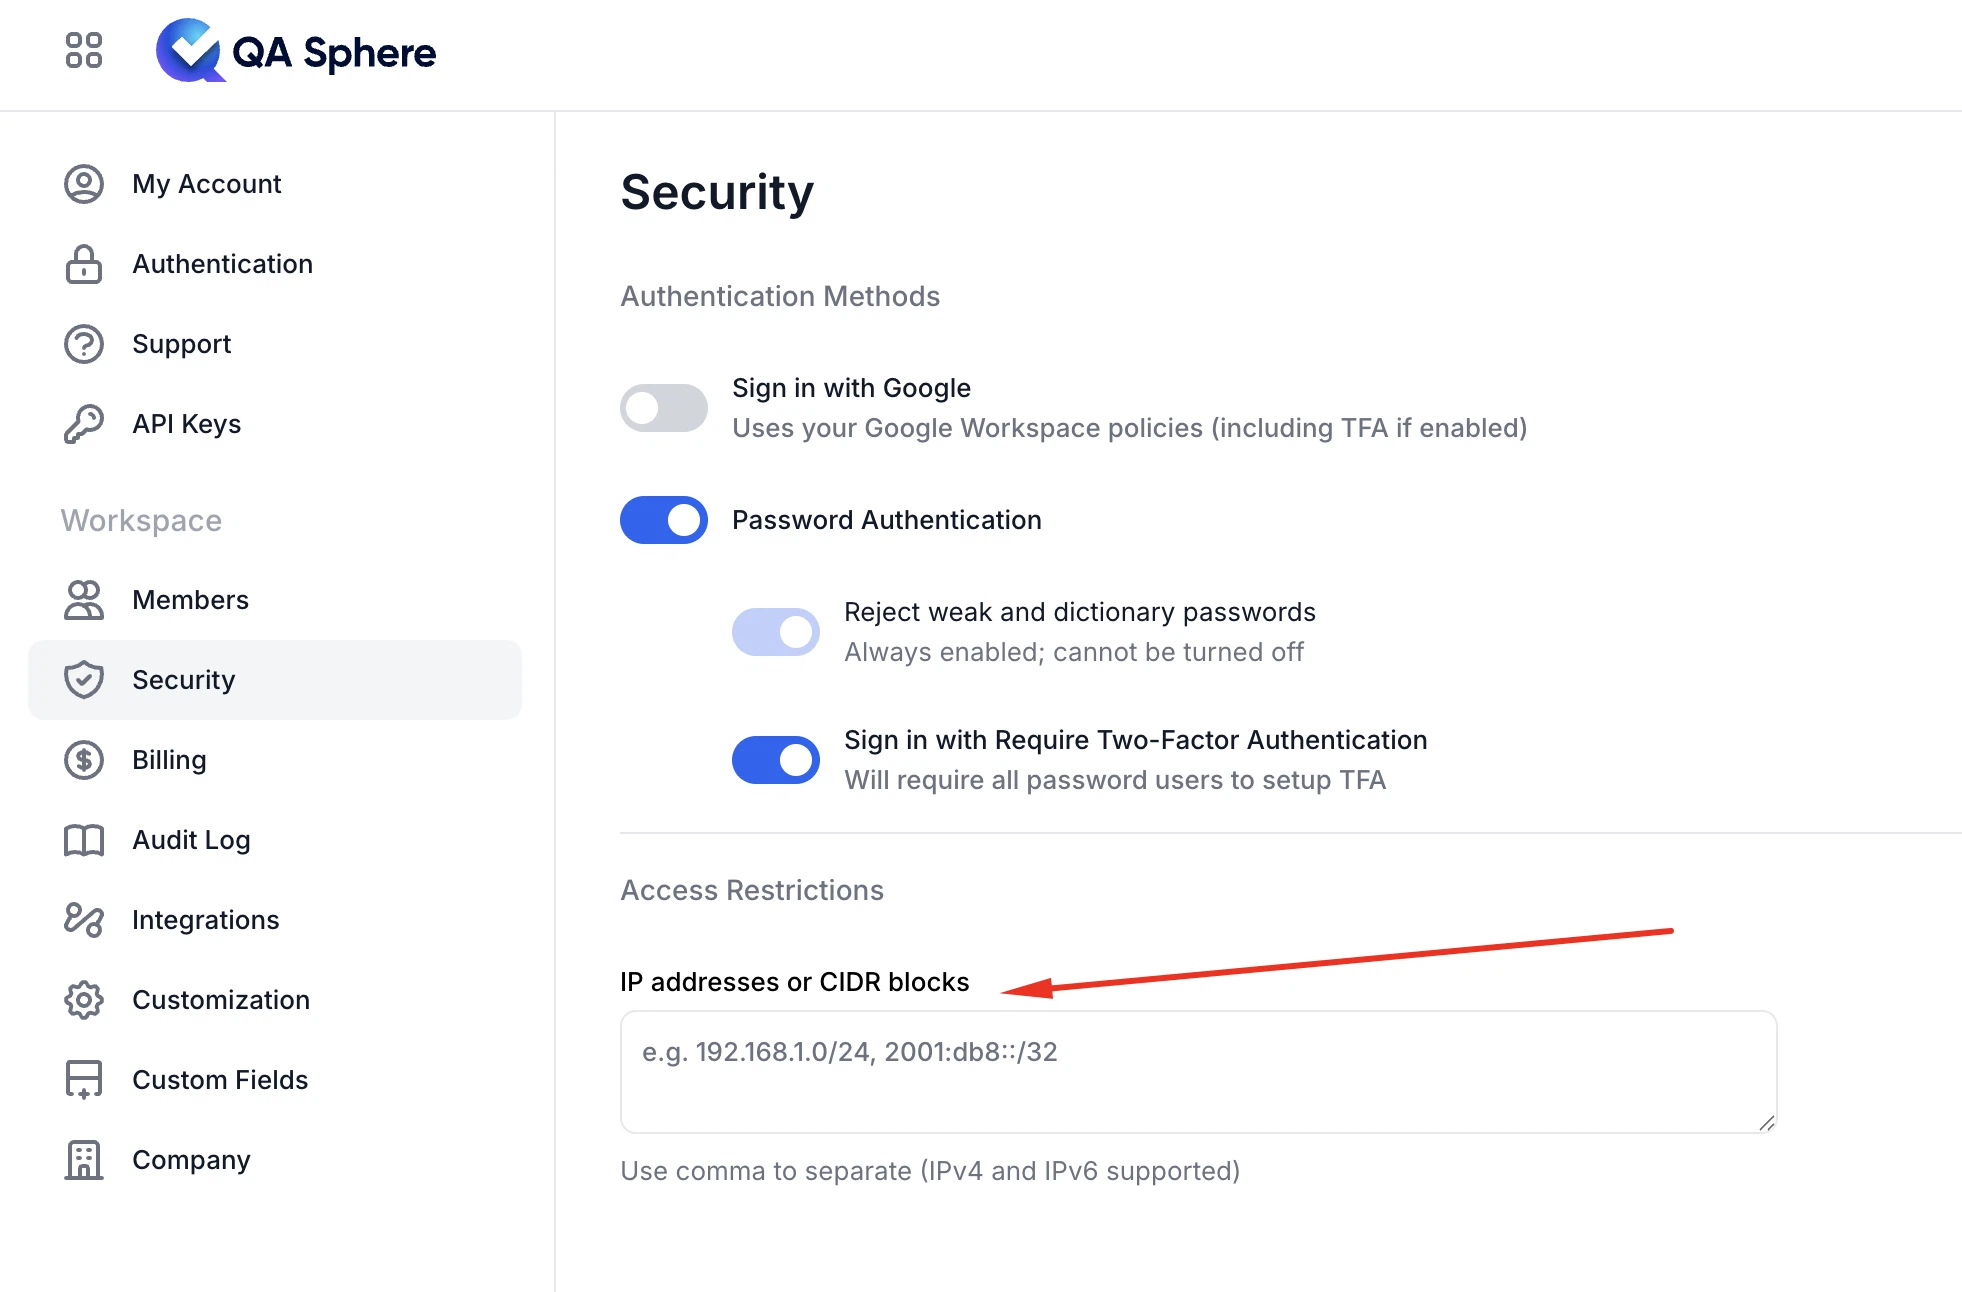 Before enabling it, work through the list of everything that reaches your workspace:
- **Your own current address**, or you will lock yourself out along with everyone else
- **Remote and travelling team members**, whose addresses change
- **CI/CD runners** that upload results through the [CLI](/docs/cli) or call the [public API](/docs/api/api_intro) — cloud runners often use wide, changing ranges
- **Webhook and integration callbacks**, if they originate from your own infrastructure
Before switching the allow list on, confirm whether it also covers API and CLI traffic in your configuration. If it does, a pipeline that uploads test results will start failing as soon as its runner's egress addresses fall outside the list. Test it against a non-critical pipeline first.
## Managing User Access
### Suspending and Restoring Users
Admins can **suspend** a user instead of deleting them. A suspended user cannot sign in, but their account and everything they authored — test cases, runs, results, audit history — is preserved intact. Restoring access is a single action.
Before enabling it, work through the list of everything that reaches your workspace:
- **Your own current address**, or you will lock yourself out along with everyone else
- **Remote and travelling team members**, whose addresses change
- **CI/CD runners** that upload results through the [CLI](/docs/cli) or call the [public API](/docs/api/api_intro) — cloud runners often use wide, changing ranges
- **Webhook and integration callbacks**, if they originate from your own infrastructure
Before switching the allow list on, confirm whether it also covers API and CLI traffic in your configuration. If it does, a pipeline that uploads test results will start failing as soon as its runner's egress addresses fall outside the list. Test it against a non-critical pipeline first.
## Managing User Access
### Suspending and Restoring Users
Admins can **suspend** a user instead of deleting them. A suspended user cannot sign in, but their account and everything they authored — test cases, runs, results, audit history — is preserved intact. Restoring access is a single action.
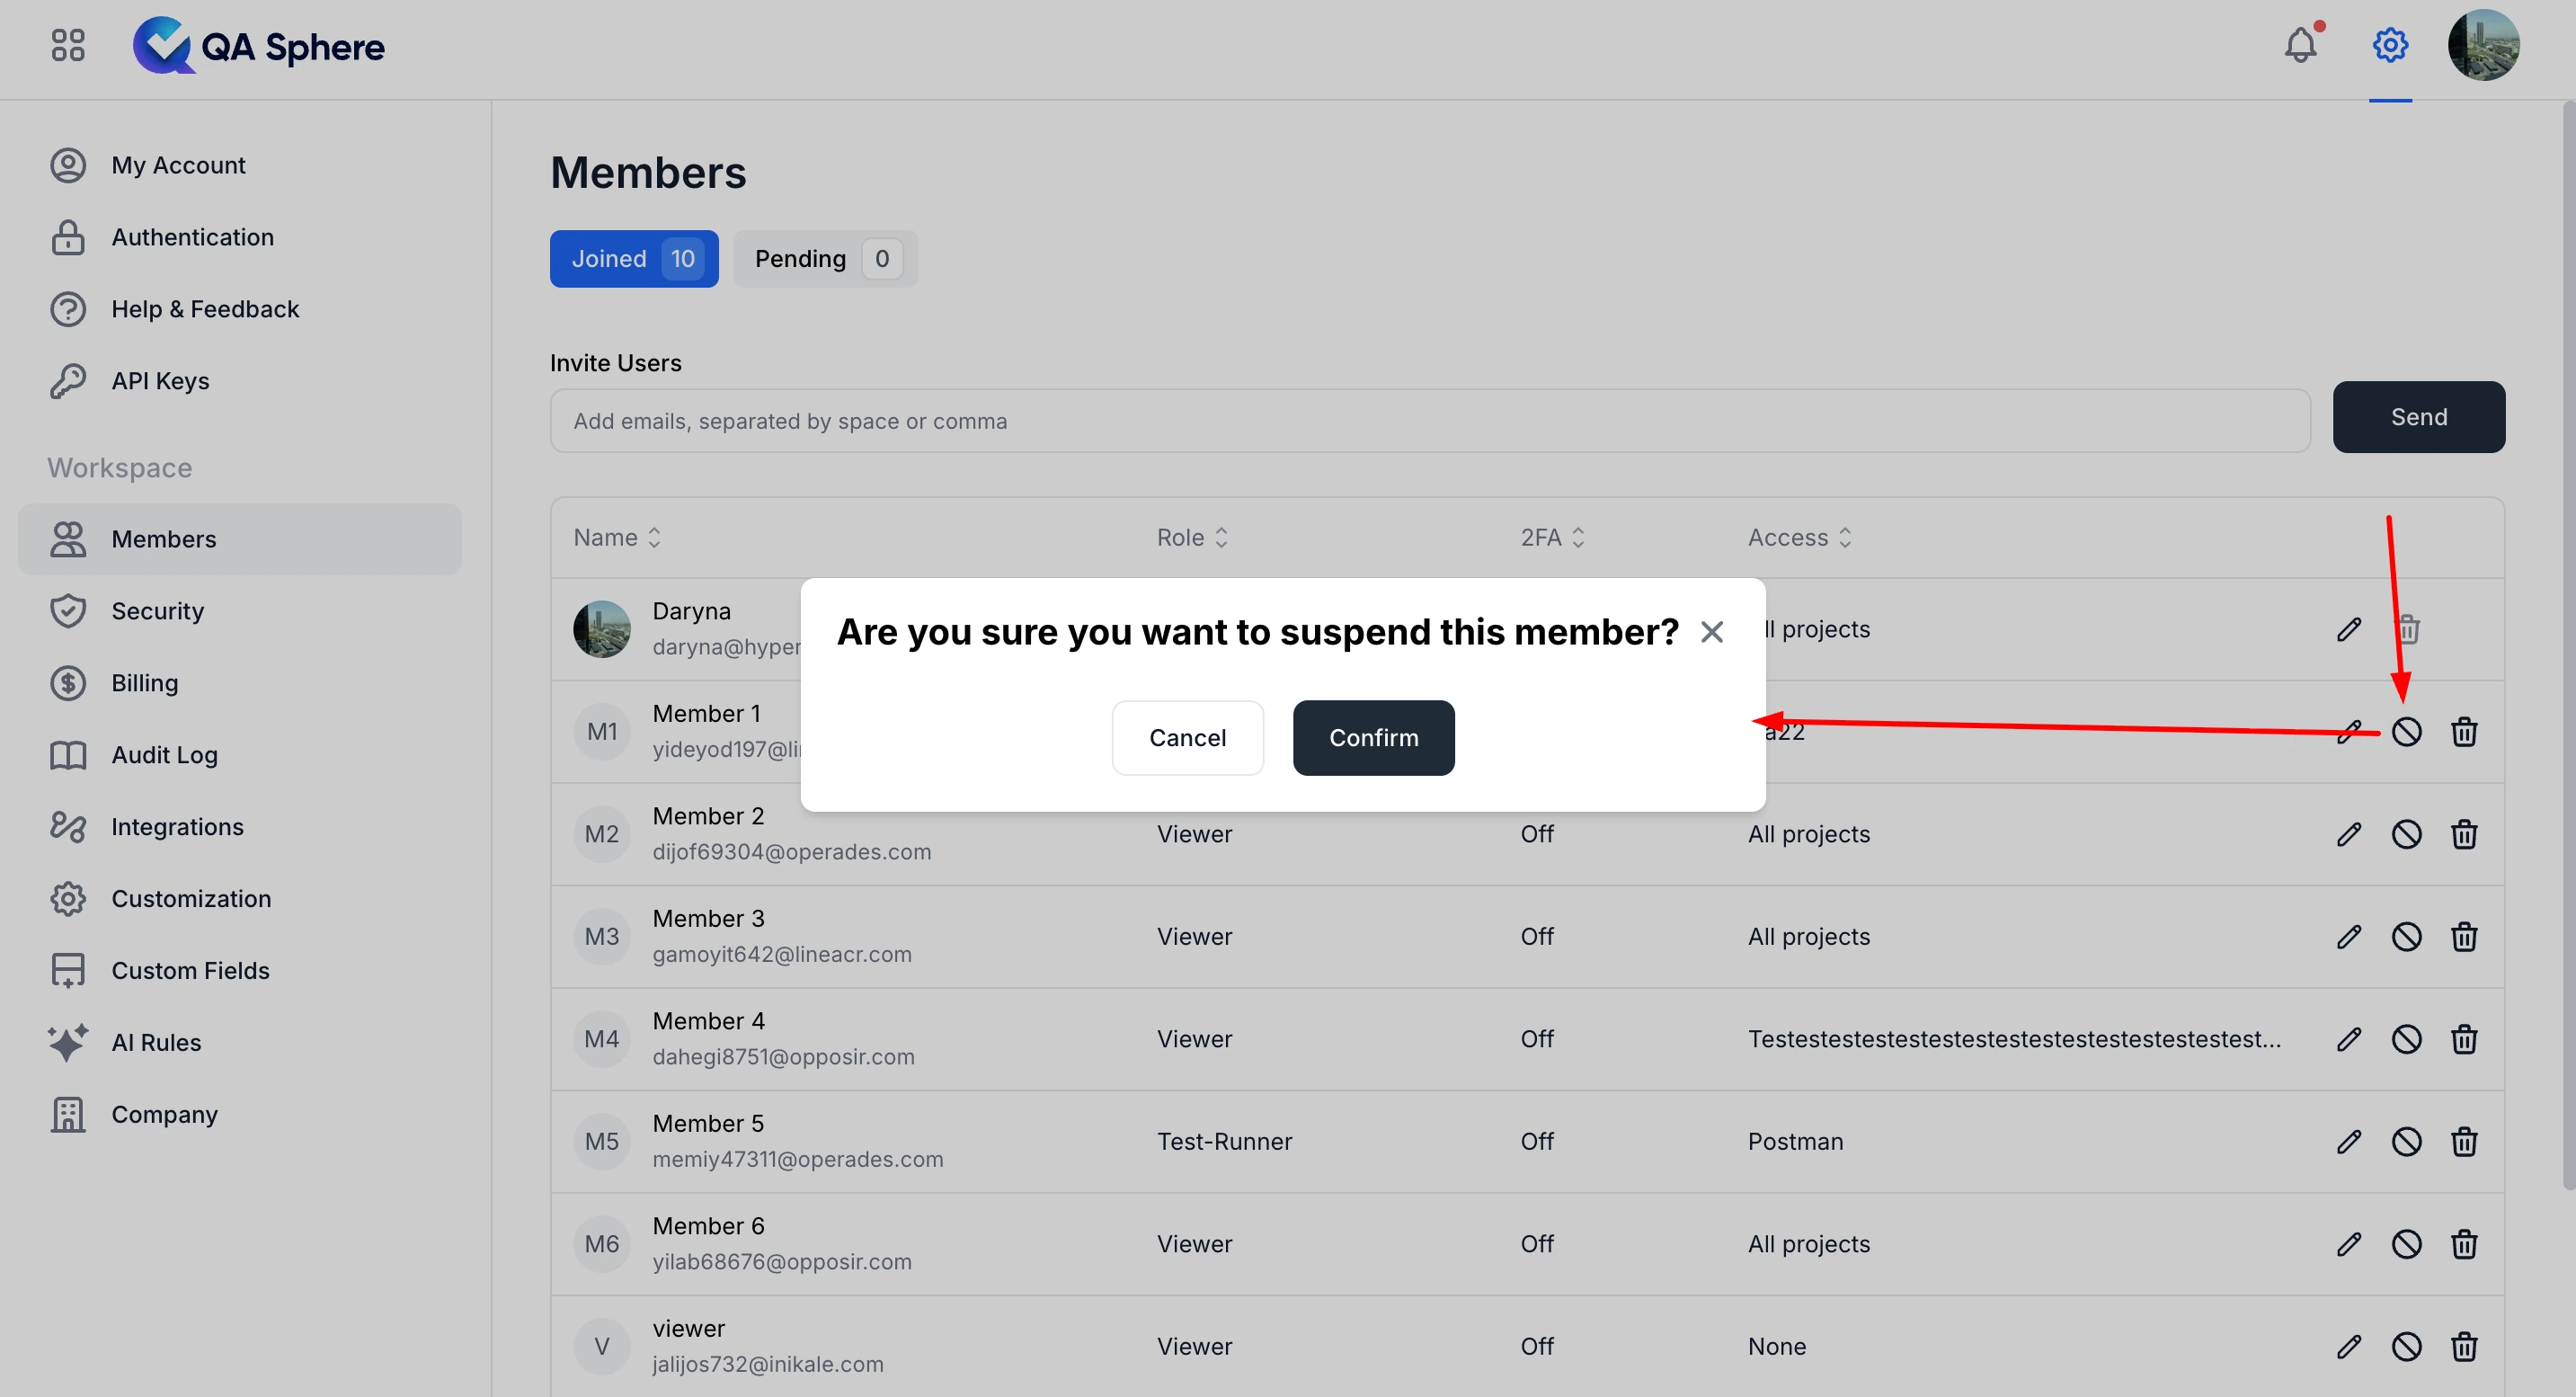 Suspend rather than delete when someone leaves a team temporarily, when an account may be compromised, or when you want to free a seat without losing attribution. See [Users and Permissions](https://qasphere.com/docs/users-permissions) for roles and project access.
API keys owned by a suspended user stop working: requests made with them return `403`. If a departing user's key is used by a pipeline, reissue the key under a different account before suspending them.
### Automated Provisioning
On the Business plan, [SCIM 2.0](/docs/scim) lets your identity provider create, update, and deactivate QA Sphere users automatically. Setting `active: false` from the IdP suspends the user in the same way as the manual action above; `active: true` restores them.
## Audit Log
Every significant action in the workspace is recorded in the audit log, viewable under **Settings → Audit Log**. It covers user and permission changes, integration and webhook configuration changes, SCIM-driven changes, and **rejected authentication attempts**, which can be filtered specifically when investigating suspicious sign-in activity.
For SIEM ingestion, the audit log is available through the public API, and you can create API keys restricted to only that endpoint by naming them with the `SIEM-LOG-ONLY` prefix — a key named `SIEM-LOG-ONLY-splunk` can read audit logs and nothing else. See the [Audit Logs API](/docs/api/audit_logs).
## What Each Plan Includes
| Control | Free | Standard | Business | Enterprise |
| --- | --- | --- | --- | --- |
| Two-factor authentication (per user) | Yes | Yes | Yes | Yes |
| Google Sign-In (and its domain allowlist) | — | Yes | Yes | Yes |
| SAML 2.0 SSO | — | — | Yes | Yes |
| SCIM provisioning | — | — | Yes | Yes |
| Audit log | Basic | Basic | Extended | Extended |
| **Advanced authentication**: 2FA enforcement, IP allow list, audit log API for SIEM | — | — | Yes | Yes |
See [Billing](https://qasphere.com/docs/billing) for full plan details.
---
# Users and Permissions
URL: /docs/users-permissions
Effective user management and role-based access control are crucial for maintaining security and efficiency in your QA processes. QA Sphere offers a flexible and robust permissions system that allows you to fine-tune access levels for each member of your team. This guide will walk you through the various roles available in QA Sphere and how to manage them.
## Understanding QA Sphere Roles
QA Sphere provides five distinct roles, each with its own set of permissions and responsibilities. These roles are designed to cater to different levels of involvement and authority within your QA process.
### 1. Owner
The Owner role is the highest level of authority in QA Sphere.
**Key Characteristics:**
- There can only be one Owner per QA Sphere instance.
- The Owner is typically the first user who set up the QA Sphere account.
- This role cannot be deleted.
**Permissions:**
- Has unrestricted access to all features and settings.
- Can change anything within the system.
- Can assign the Owner role to another user (in which case, the current Owner becomes an Admin).
**Best Practices:**
- Reserve this role for the highest level of management or the primary stakeholder of the QA process.
- Consider transitioning to an Admin role once the system is set up and stable, to reduce the risk of accidental system-wide changes.
### 2. Admin
The Admin role is designed for users who need comprehensive control over the QA Sphere instance, but with some limitations compared to the Owner.
**Permissions:**
- Can change almost anything in the system.
- Has access to all projects and global settings.
- Can manage users, including creating new users and assigning roles.
- Cannot delete the Owner or change the Owner's permissions.
**Best Practices:**
- Assign this role to QA managers or team leads who need to oversee multiple projects and manage team members.
- Limit the number of Admins to maintain better control and security.
### 3. User
The User role is suitable for team members actively involved in the QA process across one or more projects.
**Permissions:**
- Can work on specific projects or all projects (as assigned by an Admin or Owner).
- Can create and manage test runs, milestones, and test cases within their assigned projects.
- Cannot add new projects, rename/complete/delete projects, manage users, or change global settings.
**Best Practices:**
- This should be the default role for most team members involved in creating and executing tests.
- Regularly review User project assignments to ensure they have access to all necessary projects.
### 4. Test Runner
The Test Runner role is designed for team members primarily responsible for executing test runs.
**Permissions:**
- Can work on test runs of specific projects (or all projects, as assigned).
- Can update test run status and results.
- Cannot modify test cases or create new ones.
- Cannot change project settings or manage users.
**Best Practices:**
- Assign this role to team members focused on test execution, such as QA testers or automated testing systems.
- Ensure Test Runners have clear guidelines on how to report and document test results.
### 5. Viewer
The Viewer role provides read-only access to QA Sphere, suitable for stakeholders who need to monitor progress but should not make changes.
**Permissions:**
- Can view information in specific projects or all projects (as assigned).
- All access is read-only; cannot make any changes to test cases, runs, or settings.
**Best Practices:**
- Use this role for external stakeholders, clients, or team members who need to stay informed but are not directly involved in the QA process.
- Regularly review Viewer access to ensure they only have visibility to relevant projects.
Viewer seats are **unlimited and free** on paid plans. Stakeholders who only need to follow quality status should be Viewers — they do not count toward your per-user bill. See [Billing](https://qasphere.com/docs/billing#viewers-do-not-consume-seats).
## Project Access
A role decides *what* a user can do; project access decides *where* they can do it. Users, Test Runners, and Viewers are granted access either to **all projects** or to a specific set of projects, chosen when you invite them and changeable at any time from **Settings → Members**.
Owners and Admins always have access to every project, so project access does not apply to them.
The **Access** column in the Members table shows each user's current scope, and the table can be sorted by it — useful when reviewing who can reach a sensitive project.
## Managing Users and Permissions
As an Owner or Admin, you have the responsibility of managing users and their permissions. Here's how to effectively manage your team in QA Sphere:
1. **Adding New Users:**
- Navigate to the **Settings**
Suspend rather than delete when someone leaves a team temporarily, when an account may be compromised, or when you want to free a seat without losing attribution. See [Users and Permissions](https://qasphere.com/docs/users-permissions) for roles and project access.
API keys owned by a suspended user stop working: requests made with them return `403`. If a departing user's key is used by a pipeline, reissue the key under a different account before suspending them.
### Automated Provisioning
On the Business plan, [SCIM 2.0](/docs/scim) lets your identity provider create, update, and deactivate QA Sphere users automatically. Setting `active: false` from the IdP suspends the user in the same way as the manual action above; `active: true` restores them.
## Audit Log
Every significant action in the workspace is recorded in the audit log, viewable under **Settings → Audit Log**. It covers user and permission changes, integration and webhook configuration changes, SCIM-driven changes, and **rejected authentication attempts**, which can be filtered specifically when investigating suspicious sign-in activity.
For SIEM ingestion, the audit log is available through the public API, and you can create API keys restricted to only that endpoint by naming them with the `SIEM-LOG-ONLY` prefix — a key named `SIEM-LOG-ONLY-splunk` can read audit logs and nothing else. See the [Audit Logs API](/docs/api/audit_logs).
## What Each Plan Includes
| Control | Free | Standard | Business | Enterprise |
| --- | --- | --- | --- | --- |
| Two-factor authentication (per user) | Yes | Yes | Yes | Yes |
| Google Sign-In (and its domain allowlist) | — | Yes | Yes | Yes |
| SAML 2.0 SSO | — | — | Yes | Yes |
| SCIM provisioning | — | — | Yes | Yes |
| Audit log | Basic | Basic | Extended | Extended |
| **Advanced authentication**: 2FA enforcement, IP allow list, audit log API for SIEM | — | — | Yes | Yes |
See [Billing](https://qasphere.com/docs/billing) for full plan details.
---
# Users and Permissions
URL: /docs/users-permissions
Effective user management and role-based access control are crucial for maintaining security and efficiency in your QA processes. QA Sphere offers a flexible and robust permissions system that allows you to fine-tune access levels for each member of your team. This guide will walk you through the various roles available in QA Sphere and how to manage them.
## Understanding QA Sphere Roles
QA Sphere provides five distinct roles, each with its own set of permissions and responsibilities. These roles are designed to cater to different levels of involvement and authority within your QA process.
### 1. Owner
The Owner role is the highest level of authority in QA Sphere.
**Key Characteristics:**
- There can only be one Owner per QA Sphere instance.
- The Owner is typically the first user who set up the QA Sphere account.
- This role cannot be deleted.
**Permissions:**
- Has unrestricted access to all features and settings.
- Can change anything within the system.
- Can assign the Owner role to another user (in which case, the current Owner becomes an Admin).
**Best Practices:**
- Reserve this role for the highest level of management or the primary stakeholder of the QA process.
- Consider transitioning to an Admin role once the system is set up and stable, to reduce the risk of accidental system-wide changes.
### 2. Admin
The Admin role is designed for users who need comprehensive control over the QA Sphere instance, but with some limitations compared to the Owner.
**Permissions:**
- Can change almost anything in the system.
- Has access to all projects and global settings.
- Can manage users, including creating new users and assigning roles.
- Cannot delete the Owner or change the Owner's permissions.
**Best Practices:**
- Assign this role to QA managers or team leads who need to oversee multiple projects and manage team members.
- Limit the number of Admins to maintain better control and security.
### 3. User
The User role is suitable for team members actively involved in the QA process across one or more projects.
**Permissions:**
- Can work on specific projects or all projects (as assigned by an Admin or Owner).
- Can create and manage test runs, milestones, and test cases within their assigned projects.
- Cannot add new projects, rename/complete/delete projects, manage users, or change global settings.
**Best Practices:**
- This should be the default role for most team members involved in creating and executing tests.
- Regularly review User project assignments to ensure they have access to all necessary projects.
### 4. Test Runner
The Test Runner role is designed for team members primarily responsible for executing test runs.
**Permissions:**
- Can work on test runs of specific projects (or all projects, as assigned).
- Can update test run status and results.
- Cannot modify test cases or create new ones.
- Cannot change project settings or manage users.
**Best Practices:**
- Assign this role to team members focused on test execution, such as QA testers or automated testing systems.
- Ensure Test Runners have clear guidelines on how to report and document test results.
### 5. Viewer
The Viewer role provides read-only access to QA Sphere, suitable for stakeholders who need to monitor progress but should not make changes.
**Permissions:**
- Can view information in specific projects or all projects (as assigned).
- All access is read-only; cannot make any changes to test cases, runs, or settings.
**Best Practices:**
- Use this role for external stakeholders, clients, or team members who need to stay informed but are not directly involved in the QA process.
- Regularly review Viewer access to ensure they only have visibility to relevant projects.
Viewer seats are **unlimited and free** on paid plans. Stakeholders who only need to follow quality status should be Viewers — they do not count toward your per-user bill. See [Billing](https://qasphere.com/docs/billing#viewers-do-not-consume-seats).
## Project Access
A role decides *what* a user can do; project access decides *where* they can do it. Users, Test Runners, and Viewers are granted access either to **all projects** or to a specific set of projects, chosen when you invite them and changeable at any time from **Settings → Members**.
Owners and Admins always have access to every project, so project access does not apply to them.
The **Access** column in the Members table shows each user's current scope, and the table can be sorted by it — useful when reviewing who can reach a sensitive project.
## Managing Users and Permissions
As an Owner or Admin, you have the responsibility of managing users and their permissions. Here's how to effectively manage your team in QA Sphere:
1. **Adding New Users:**
- Navigate to the **Settings**  > **Members**.
- Use **Email** field to invite new users to the team
- Assign the appropriate role and project access and click **Send Invite**.
2. **Modifying User Roles:**
- Navigate to the **Settings**
> **Members**.
- Use **Email** field to invite new users to the team
- Assign the appropriate role and project access and click **Send Invite**.
2. **Modifying User Roles:**
- Navigate to the **Settings**  - Change **Role** in the appropriate field
3. **Reviewing the Member List:**
- The Members table can be sorted by Name/Email, Role, 2FA, and Access. Sorting cycles ascending → descending → reset, and the indicators stay visible.
- Sorting by **2FA** is the quickest way to see who has not yet enrolled, which matters before you [enforce two-factor authentication](https://qasphere.com/docs/administration/security#enforcing-2fa-workspace-wide).
4. **Best Practices for User Management:**
- Regularly audit user roles and permissions to ensure they align with current responsibilities.
- Implement a process for reviewing and updating permissions when team members change roles.
- Use groups to manage permissions for multiple users with similar roles more efficiently.
- Always follow the principle of least privilege: give users only the permissions they need to perform their tasks.
## Suspending and Restoring Access
When someone should lose access but their history should be kept, **suspend** them instead of deleting the account. A suspended user cannot sign in, while everything they authored — test cases, runs, results, and audit history — stays intact and correctly attributed. Restoring access is a single action.
- Change **Role** in the appropriate field
3. **Reviewing the Member List:**
- The Members table can be sorted by Name/Email, Role, 2FA, and Access. Sorting cycles ascending → descending → reset, and the indicators stay visible.
- Sorting by **2FA** is the quickest way to see who has not yet enrolled, which matters before you [enforce two-factor authentication](https://qasphere.com/docs/administration/security#enforcing-2fa-workspace-wide).
4. **Best Practices for User Management:**
- Regularly audit user roles and permissions to ensure they align with current responsibilities.
- Implement a process for reviewing and updating permissions when team members change roles.
- Use groups to manage permissions for multiple users with similar roles more efficiently.
- Always follow the principle of least privilege: give users only the permissions they need to perform their tasks.
## Suspending and Restoring Access
When someone should lose access but their history should be kept, **suspend** them instead of deleting the account. A suspended user cannot sign in, while everything they authored — test cases, runs, results, and audit history — stays intact and correctly attributed. Restoring access is a single action.